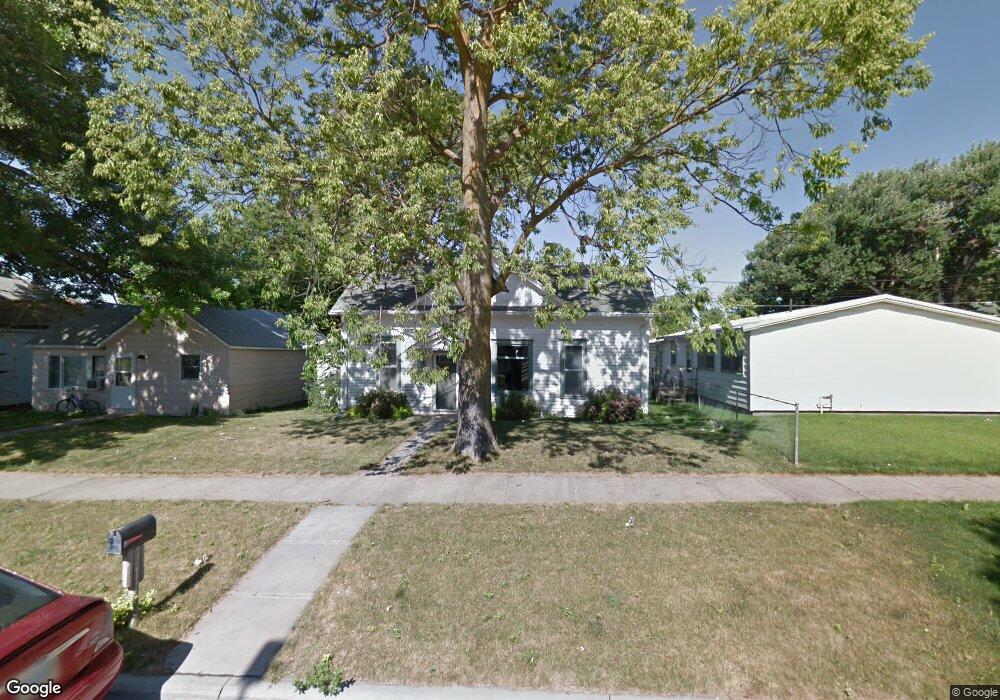
333 N 10th Ave Broken Bow, NE 68822
Estimated Value: $151,560 - $169,000
Studio
--
Bath
1,152
Sq Ft
$141/Sq Ft
Est. Value
About This Home
This home is located at 333 N 10th Ave, Broken Bow, NE 68822 and is currently estimated at $162,140, approximately $140 per square foot. 333 N 10th Ave is a home located in Custer County with nearby schools including North Park Elementary School, Broken Bow Junior High School, and Broken Bow High School.
Ownership History
Date
Name
Owned For
Owner Type
Purchase Details
Closed on
May 26, 2015
Sold by
Butler William G and Butler Kelly M
Bought by
Opportunity Land Investments Llc
Current Estimated Value
Purchase Details
Closed on
May 16, 2014
Sold by
Brugger Leroy Harley
Bought by
Butler William G and Butler
Purchase Details
Closed on
Jan 19, 2012
Sold by
Butler William G
Bought by
Brugger Leroy Harley
Purchase Details
Closed on
Jul 25, 2011
Sold by
Ascent Community Redevelopment Ass
Bought by
Butler William D
Purchase Details
Closed on
Apr 11, 2011
Sold by
Citi Mortgage Inc
Bought by
Ascent Community Redevelopment Ass
Purchase Details
Closed on
Nov 16, 2010
Sold by
Lindquist Eric H
Bought by
Citimortgage Inc
Create a Home Valuation Report for This Property
The Home Valuation Report is an in-depth analysis detailing your home's value as well as a comparison with similar homes in the area
Home Values in the Area
Average Home Value in this Area
Purchase History
We collect this data history from publicly available records. To have your information removed, we recommend requesting removal directly through your county’s website.
| Date | Buyer | Sale Price | Title Company |
|---|---|---|---|
| Opportunity Land Investments Llc | $88,500 | -- | |
| Butler William G | $12,500 | -- | |
| Brugger Leroy Harley | $9,500 | -- | |
| Butler William D | $8,000 | -- | |
| Ascent Community Redevelopment Ass | -- | -- | |
| Citimortgage Inc | $19,300 | -- |
Source: Public Records
Tax History
| Year | Tax Paid | Tax Assessment Tax Assessment Total Assessment is a certain percentage of the fair market value that is determined by local assessors to be the total taxable value of land and additions on the property. | Land | Improvement |
|---|---|---|---|---|
| 2025 | $1,758 | $137,612 | $11,261 | $126,351 |
| 2024 | $1,756 | $124,977 | $11,261 | $113,716 |
| 2023 | $1,457 | $92,987 | $11,261 | $81,726 |
| 2022 | $1,551 | $84,494 | $11,261 | $73,233 |
| 2021 | $1,507 | $84,004 | $10,771 | $73,233 |
| 2020 | $1,433 | $80,577 | $7,344 | $73,233 |
| 2019 | $1,459 | $82,170 | $3,672 | $78,498 |
| 2017 | $1,396 | $76,421 | $3,672 | $72,749 |
| 2016 | $1,502 | $75,148 | $2,399 | $72,749 |
| 2015 | $453 | $22,489 | $2,371 | $20,118 |
| 2014 | $453 | $20,444 | $2,155 | $18,289 |
Source: Public Records
Map
Nearby Homes
Your Personal Tour Guide
Ask me questions while you tour the home.