333 S Logan St Elyria, OH 44035
Elyria AreaEstimated Value: $125,000 - $170,000
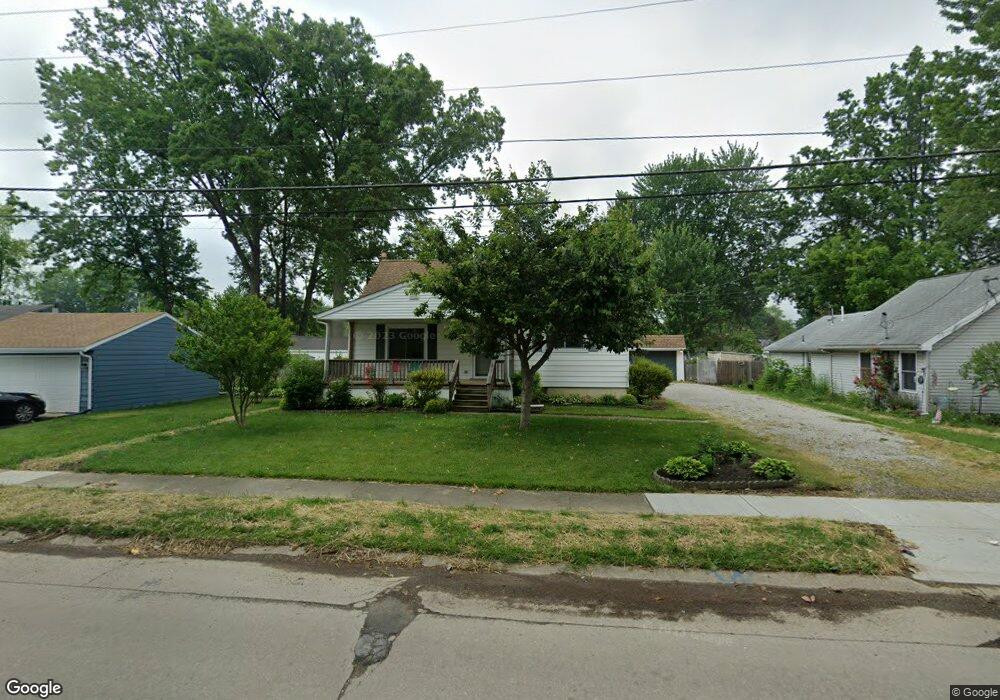
About This Home
This home is located at 333 S Logan St, Elyria, OH 44035 and is currently estimated at $149,958, approximately $117 per square foot. 333 S Logan St is a home located in Lorain County with nearby schools including Eastern Heights Middle School, Elyria High School, and Constellation Schools: Elyria Community Elementary.
Ownership History
We collect this data history from publicly available records. To have your information removed, we recommend requesting removal directly through your county’s website.
Purchase Details
Home Financials for this Owner
Home Financials are based on the most recent Mortgage that was taken out on this home.Home Values in the Area
Average Home Value in this Area
Purchase History
We collect this data history from publicly available records. To have your information removed, we recommend requesting removal directly through your county’s website.
| Date | Buyer | Sale Price | Title Company |
|---|---|---|---|
| $102,000 | Infinity Title |
Mortgage History
We collect this data history from publicly available records. To have your information removed, we recommend requesting removal directly through your county’s website.
| Date | Status | Borrower | Loan Amount |
|---|---|---|---|
| Open | $98,940 | ||
| Previous Owner | $75,213 | ||
| Previous Owner | $15,840 | ||
| Previous Owner | $12,426 | ||
| Previous Owner | $89,105 | ||
| Previous Owner | $86,157 |
Tax History
We collect this data history from publicly available records. To have your information removed, we recommend requesting removal directly through your county’s website.
| Year | Tax Paid | Tax Assessment Tax Assessment Total Assessment is a certain percentage of the fair market value that is determined by local assessors to be the total taxable value of land and additions on the property. | Land | Improvement |
|---|---|---|---|---|
| 2024 | $1,931 | $40,810 | $13,157 | $27,654 |
| 2023 | $2,091 | $38,374 | $10,623 | $27,752 |
| 2022 | $2,083 | $38,374 | $10,623 | $27,752 |
| 2021 | $2,088 | $38,374 | $10,623 | $27,752 |
| 2020 | $1,837 | $30,020 | $8,310 | $21,710 |
| 2019 | $1,825 | $30,020 | $8,310 | $21,710 |
| 2018 | $1,855 | $30,020 | $8,310 | $21,710 |
| 2017 | $1,881 | $29,600 | $8,430 | $21,170 |
| 2016 | $1,856 | $29,600 | $8,430 | $21,170 |
| 2015 | $1,738 | $29,600 | $8,430 | $21,170 |
| 2014 | $1,873 | $30,730 | $8,750 | $21,980 |
| 2013 | $1,767 | $30,730 | $8,750 | $21,980 |
Map
- 810 E Broad St
- 513 Henry St
- 715 S Logan St
- 124 Acorn Ln
- 103 Acorn Ln
- 626 Princeton Ave
- 624 Eastern Heights Blvd
- 828 S Logan St
- 701 Denison Ave
- 522 Eastern Heights Blvd
- 521 Cambridge Ave
- 169 Boston Ave
- 157 Fairlawn Ave
- 544 Purdue Ave
- 148 Bentley Dr Unit 25
- 337 Harvard Ave
- 1306 Prospect St
- 334 Cornell Ave
- 237 E Broad St
- 164 Woodbury St
- 336 Boston Ave
- 328 Boston Ave
- 344 Boston Ave
- 331 S Logan St
- 326 Boston Ave
- 327 S Logan St
- 350 Boston Ave
- 335 Boston Ave
- 333 Boston Ave
- 325 S Logan St
- 343 Boston Ave
- 327 Boston Ave
- 323 S Logan St
- 912 Eastern Heights Blvd
- 325 Boston Ave
- 318 Boston Ave
- 354 Boston Ave
- 916 Eastern Heights Blvd
- 353 Boston Ave
- 321 Boston Ave
Ask me questions while you tour the home.