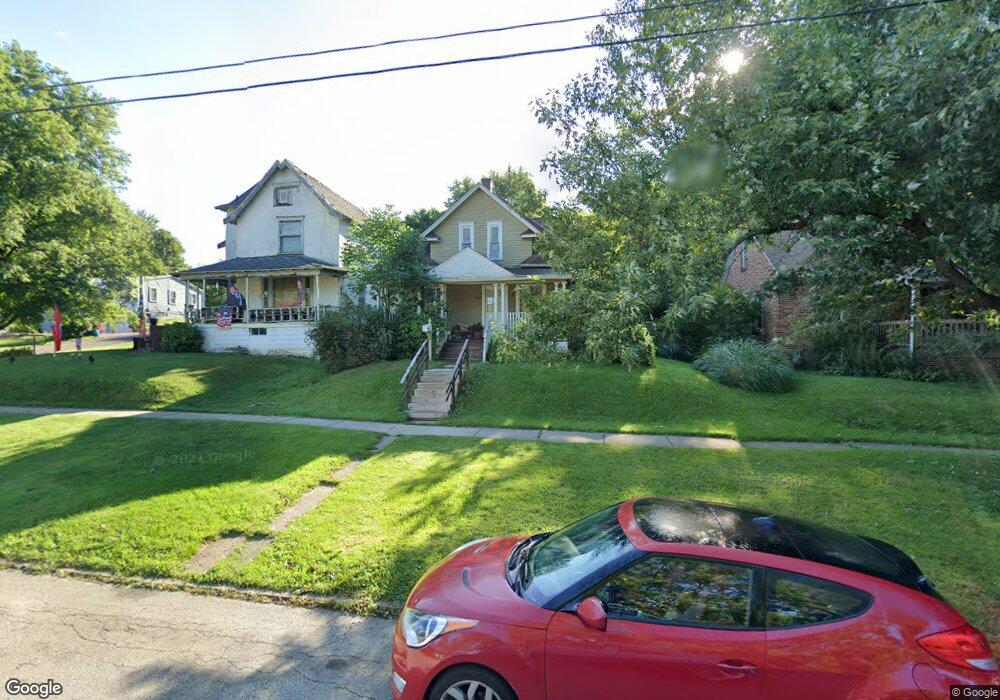
334 Central Ave Mansfield, OH 44905
Estimated Value: $69,858 - $98,000
2
Beds
1
Bath
1,350
Sq Ft
$66/Sq Ft
Est. Value
About This Home
This home is located at 334 Central Ave, Mansfield, OH 44905 and is currently estimated at $89,465, approximately $66 per square foot. 334 Central Ave is a home located in Richland County with nearby schools including St. Peter's Elementary/Montessori School, Temple-Christian School, and St. Peter's Junior High / High School.
Ownership History
Date
Name
Owned For
Owner Type
Purchase Details
Closed on
Nov 27, 2012
Sold by
Merwine Larry D and Merwine Larry
Bought by
Sps Properties Of Mansfield Llc
Current Estimated Value
Purchase Details
Closed on
Jan 26, 2012
Sold by
Potter Carol L and Hamilton Bart
Bought by
Merwine Larry
Purchase Details
Closed on
Aug 8, 2001
Sold by
Hildebrand Esther E
Bought by
Potter Carol L
Create a Home Valuation Report for This Property
The Home Valuation Report is an in-depth analysis detailing your home's value as well as a comparison with similar homes in the area
Home Values in the Area
Average Home Value in this Area
Purchase History
| Date | Buyer | Sale Price | Title Company |
|---|---|---|---|
| Sps Properties Of Mansfield Llc | -- | Southern Title | |
| Merwine Larry | -- | Chicago Title Agency Of Nort | |
| Potter Carol L | $40,000 | -- |
Source: Public Records
Mortgage History
| Date | Status | Borrower | Loan Amount |
|---|---|---|---|
| Closed | Potter Carol L | -- |
Source: Public Records
Tax History
| Year | Tax Paid | Tax Assessment Tax Assessment Total Assessment is a certain percentage of the fair market value that is determined by local assessors to be the total taxable value of land and additions on the property. | Land | Improvement |
|---|---|---|---|---|
| 2025 | $397 | $8,300 | $1,700 | $6,600 |
| 2024 | $397 | $8,300 | $1,700 | $6,600 |
| 2023 | $397 | $8,300 | $1,700 | $6,600 |
| 2022 | $412 | $7,210 | $1,720 | $5,490 |
| 2021 | $415 | $7,210 | $1,720 | $5,490 |
| 2020 | $424 | $7,210 | $1,720 | $5,490 |
| 2019 | $470 | $7,210 | $1,720 | $5,490 |
| 2018 | $464 | $7,210 | $1,720 | $5,490 |
| 2017 | $463 | $7,210 | $1,720 | $5,490 |
| 2016 | $475 | $7,360 | $2,290 | $5,070 |
| 2015 | $454 | $7,360 | $2,290 | $5,070 |
| 2014 | $448 | $7,360 | $2,290 | $5,070 |
| 2012 | $256 | $10,960 | $2,360 | $8,600 |
Source: Public Records
Map
Nearby Homes
- 382 Orange St
- 387 Auburn St
- 411 Grace St
- 346 Newman St
- 489 Boals Ave
- 0 North St Unit 9072753
- 90 Oak St
- 266 Illinois Ave N
- 0 Lot #23128 Unit 9069815
- 146 E 1st St
- 62 Bahl Ave
- 822 Park Ave E
- 832 Park Ave E
- 580 N Mulberry St
- 195 Hedges St
- 167 S Adams St
- 118 Raymond Ave
- 524 Lida St
- 203 Home Ave
- 223 Hedges St
Your Personal Tour Guide
Ask me questions while you tour the home.