334 Corey St West Roxbury, MA 02132
West Roxbury NeighborhoodEstimated Value: $768,025 - $912,000
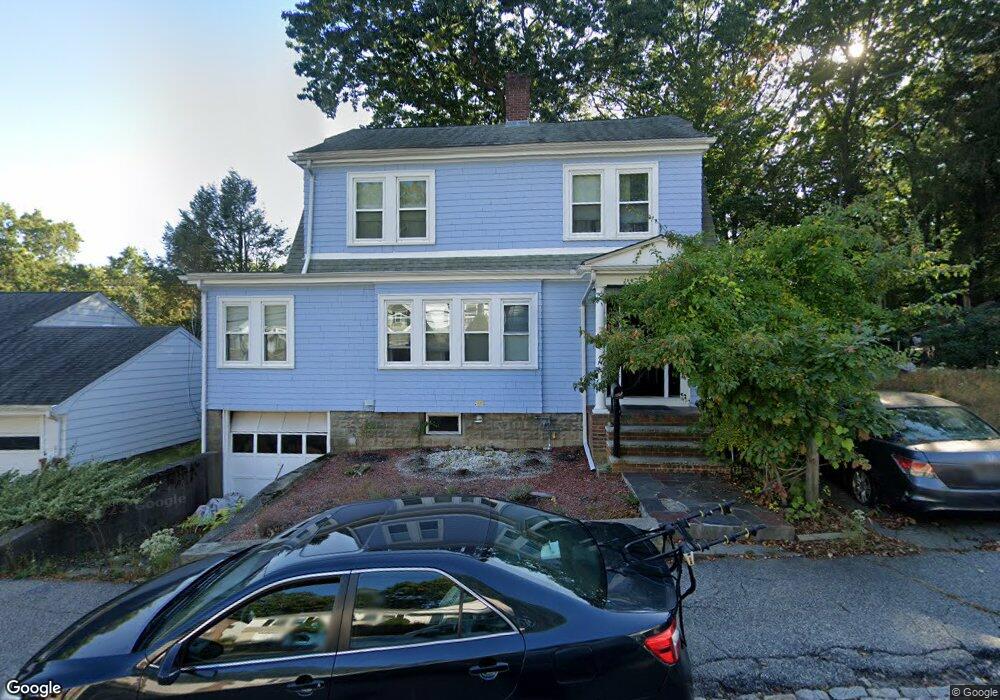
About This Home
This home is located at 334 Corey St, West Roxbury, MA 02132 and is currently estimated at $835,506, approximately $558 per square foot. 334 Corey St is a home located in Suffolk County with nearby schools including Holy Name Parish School, St Theresa School, and Catholic Memorial School.
Ownership History
We collect this data history from publicly available records. To have your information removed, we recommend requesting removal directly through your county’s website.
Purchase Details
Home Values in the Area
Average Home Value in this Area
Purchase History
We collect this data history from publicly available records. To have your information removed, we recommend requesting removal directly through your county’s website.
| Date | Buyer | Sale Price | Title Company |
|---|---|---|---|
| $161,500 | -- |
Mortgage History
We collect this data history from publicly available records. To have your information removed, we recommend requesting removal directly through your county’s website.
| Date | Status | Borrower | Loan Amount |
|---|---|---|---|
| Open | $100,000 | ||
| Open | $190,000 |
Tax History
We collect this data history from publicly available records. To have your information removed, we recommend requesting removal directly through your county’s website.
| Year | Tax Paid | Tax Assessment Tax Assessment Total Assessment is a certain percentage of the fair market value that is determined by local assessors to be the total taxable value of land and additions on the property. | Land | Improvement |
|---|---|---|---|---|
| 2025 | $7,593 | $655,700 | $209,700 | $446,000 |
| 2024 | $6,992 | $641,500 | $227,800 | $413,700 |
| 2023 | $6,688 | $622,700 | $221,100 | $401,600 |
| 2022 | $6,159 | $566,100 | $201,000 | $365,100 |
| 2021 | $5,571 | $522,100 | $191,500 | $330,600 |
| 2020 | $5,315 | $503,300 | $171,300 | $332,000 |
| 2019 | $5,099 | $483,800 | $138,400 | $345,400 |
| 2018 | $4,695 | $448,000 | $138,400 | $309,600 |
| 2017 | $4,650 | $439,100 | $138,400 | $300,700 |
| 2016 | $4,472 | $406,500 | $138,400 | $268,100 |
| 2015 | $4,931 | $407,200 | $143,500 | $263,700 |
| 2014 | $4,833 | $384,200 | $143,500 | $240,700 |
Map
- 45 Bonair St
- 89 Newfield St
- 97 Anderer Ln Unit 304
- 96 Anderer Ln Unit 5
- 188 Maple St
- 99 Anderer Ln Unit 8
- 100 Anderer Ln Unit 2
- 829 Lagrange St Unit 3
- 711 Lagrange St
- 59 Crest St
- 46 Brucewood St
- 5 Houston St
- 21 Westgate Rd Unit 4
- 24 Westgate Rd Unit 5
- 66 Bryon Rd Unit 5
- 1307 Lagrange St Unit 1307
- 68 Byron Rd Unit 5
- 60 Bryon Rd Unit 1
- 177 Perham St
- 11 Sherbrook St
- 11 Brook Farm Rd
- 330 Corey St
- 19 Brook Farm Rd
- 351 Corey St
- 355 Corey St
- 21 Brook Farm Rd
- 347 Corey St
- 715 Vfw Pkwy
- 6 Brook Farm Rd
- 6 Brook Farm Rd Unit 1
- 354 Corey St
- 2 Brook Farm Rd Unit 2
- 2 Brook Farm Rd
- 24 Brook Farm Rd
- 22 Brook Farm Rd
- 343 Corey St
- 357 Corey St
- 25 Brook Farm Rd
- 11 Cricket Ln
- 352 Corey St
Ask me questions while you tour the home.