Estimated Value: $495,000 - $554,771
4
Beds
2
Baths
2,641
Sq Ft
$202/Sq Ft
Est. Value
About This Home
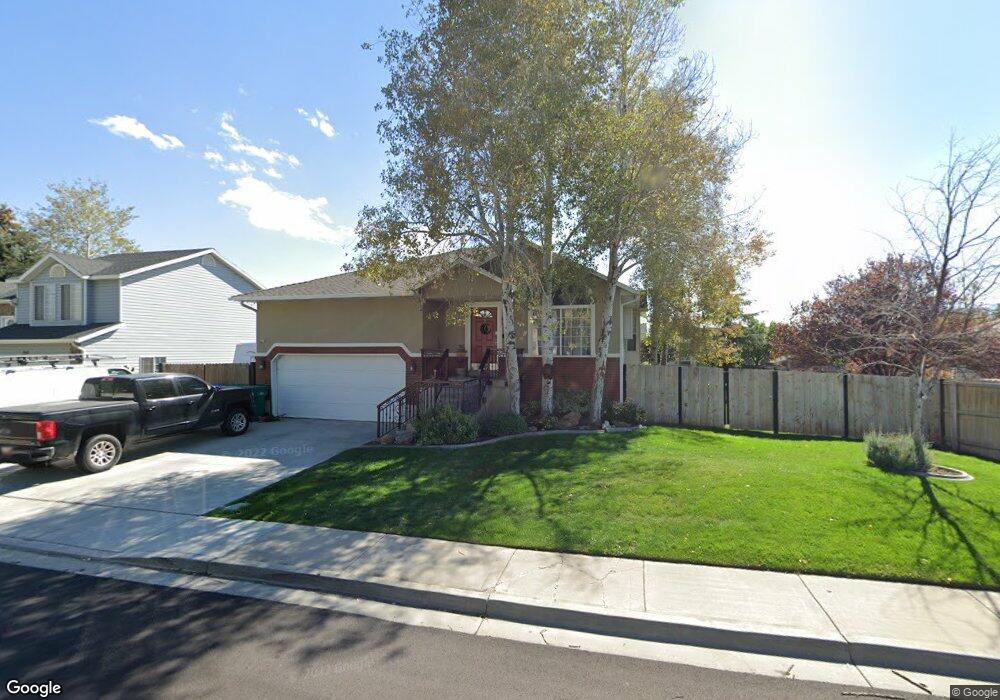
This home is located at 334 E 460 S, Lehi, UT 84043 and is currently estimated at $533,943, approximately $202 per square foot. 334 E 460 S is a home located in Utah County with nearby schools including Meadow Elementary School, Lehi Junior High School, and Lehi High School.
Ownership History
Date
Name
Owned For
Owner Type
Purchase Details
Closed on
Aug 31, 2020
Sold by
Miller Camron J and Miller Marlys
Bought by
Fischer Rebecca Lynette and Fischer Del Tyson
Current Estimated Value
Home Financials for this Owner
Home Financials are based on the most recent Mortgage that was taken out on this home.
Original Mortgage
$352,925
Outstanding Balance
$313,198
Interest Rate
2.9%
Mortgage Type
New Conventional
Estimated Equity
$220,745
Create a Home Valuation Report for This Property
The Home Valuation Report is an in-depth analysis detailing your home's value as well as a comparison with similar homes in the area
Home Values in the Area
Average Home Value in this Area
Purchase History
| Date | Buyer | Sale Price | Title Company |
|---|---|---|---|
| Fischer Rebecca Lynette | -- | Bay National Title Co |
Source: Public Records
Mortgage History
| Date | Status | Borrower | Loan Amount |
|---|---|---|---|
| Open | Fischer Rebecca Lynette | $352,925 |
Source: Public Records
Tax History
| Year | Tax Paid | Tax Assessment Tax Assessment Total Assessment is a certain percentage of the fair market value that is determined by local assessors to be the total taxable value of land and additions on the property. | Land | Improvement |
|---|---|---|---|---|
| 2025 | $2,122 | $262,515 | -- | -- |
| 2024 | $2,122 | $248,325 | $0 | $0 |
| 2023 | $2,013 | $255,750 | $0 | $0 |
| 2022 | $2,154 | $265,375 | $0 | $0 |
| 2021 | $1,942 | $361,600 | $104,200 | $257,400 |
| 2020 | $1,831 | $337,100 | $96,500 | $240,600 |
| 2019 | $1,597 | $305,700 | $96,500 | $209,200 |
| 2018 | $1,588 | $287,300 | $96,500 | $190,800 |
| 2017 | $1,505 | $144,760 | $0 | $0 |
| 2016 | $1,450 | $129,415 | $0 | $0 |
| 2015 | $1,415 | $119,900 | $0 | $0 |
| 2014 | $1,292 | $108,790 | $0 | $0 |
Source: Public Records
Map
Nearby Homes
Your Personal Tour Guide
Ask me questions while you tour the home.