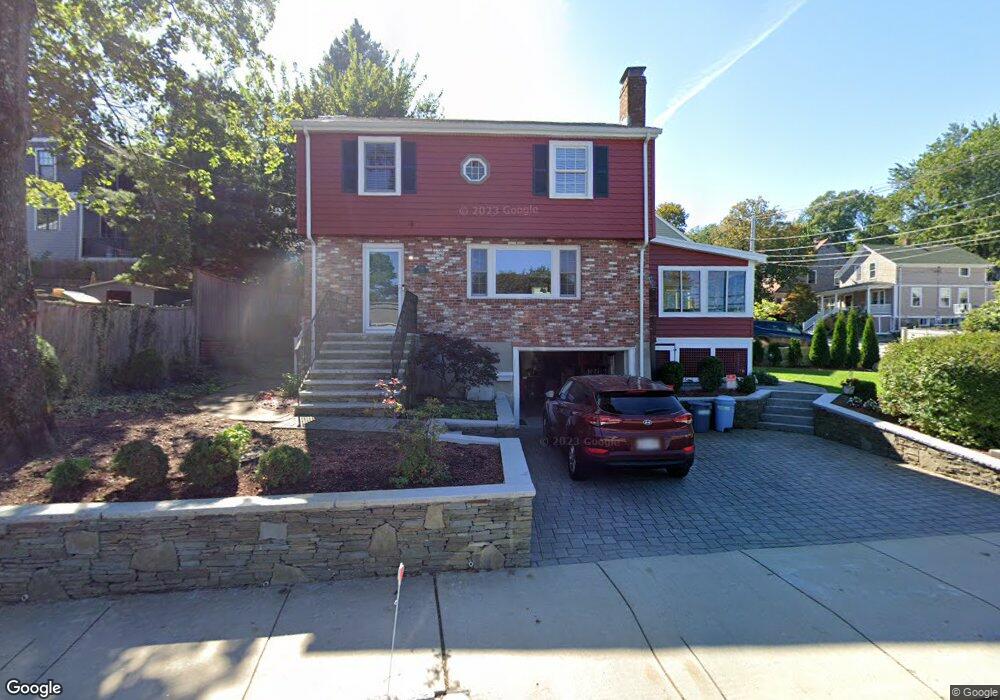
334 Gray St Arlington, MA 02476
Arlington Heights NeighborhoodEstimated Value: $652,000 - $1,192,000
About This Home
This home is located at 334 Gray St, Arlington, MA 02476 and is currently estimated at $992,012, approximately $571 per square foot. 334 Gray St is a home located in Middlesex County with nearby schools including Brackett Elementary School, Dallin Elementary School, and Ottoson Middle School.
Ownership History
We collect this data history from publicly available records. To have your information removed, we recommend requesting removal directly through your county’s website.
Purchase Details
Home Financials for this Owner
Home Financials are based on the most recent Mortgage that was taken out on this home.Purchase Details
Home Financials for this Owner
Home Financials are based on the most recent Mortgage that was taken out on this home.Home Values in the Area
Average Home Value in this Area
Purchase History
We collect this data history from publicly available records. To have your information removed, we recommend requesting removal directly through your county’s website.
| Date | Buyer | Sale Price | Title Company |
|---|---|---|---|
| -- | -- | ||
| $208,000 | -- |
Mortgage History
We collect this data history from publicly available records. To have your information removed, we recommend requesting removal directly through your county’s website.
| Date | Status | Borrower | Loan Amount |
|---|---|---|---|
| Open | $194,500 | ||
| Previous Owner | $9,000 | ||
| Previous Owner | $197,600 |
Tax History
We collect this data history from publicly available records. To have your information removed, we recommend requesting removal directly through your county’s website.
| Year | Tax Paid | Tax Assessment Tax Assessment Total Assessment is a certain percentage of the fair market value that is determined by local assessors to be the total taxable value of land and additions on the property. | Land | Improvement |
|---|---|---|---|---|
| 2025 | $10,021 | $930,500 | $562,100 | $368,400 |
| 2024 | $9,313 | $879,400 | $539,600 | $339,800 |
| 2023 | $8,694 | $775,600 | $472,100 | $303,500 |
| 2022 | $8,379 | $733,700 | $449,700 | $284,000 |
| 2021 | $8,228 | $725,600 | $449,700 | $275,900 |
| 2020 | $8,025 | $725,600 | $449,700 | $275,900 |
| 2019 | $7,194 | $638,900 | $421,600 | $217,300 |
| 2018 | $6,863 | $565,800 | $348,500 | $217,300 |
| 2017 | $6,754 | $537,700 | $320,400 | $217,300 |
| 2016 | $6,523 | $509,600 | $292,300 | $217,300 |
| 2015 | $6,783 | $500,600 | $286,700 | $213,900 |
Map
- 85 Oakland Ave
- 45 Grandview Rd
- 21 Fessenden Rd Unit 23
- 45 Pine Ridge Rd
- 26 Laurel St
- 66-68 Mount Vernon St
- 147 Oakland Ave
- 95 Grandview Rd
- 1205 Massachusetts Ave
- 10 Richardson Ave Unit 2
- 11 Lowell St Unit 11B
- 165 Park Ave Unit 165
- 30 Gloucester St Unit 30
- 993 Massachusetts Ave Unit 212
- 993 Massachusetts Ave Unit 203
- 29 Coleman Rd Unit A
- 27 Park Cir
- 39-41 Forest St Unit 39A
- 1263 Massachusetts Ave Unit 1
- 31 Coleman Rd Unit 1
Ask me questions while you tour the home.