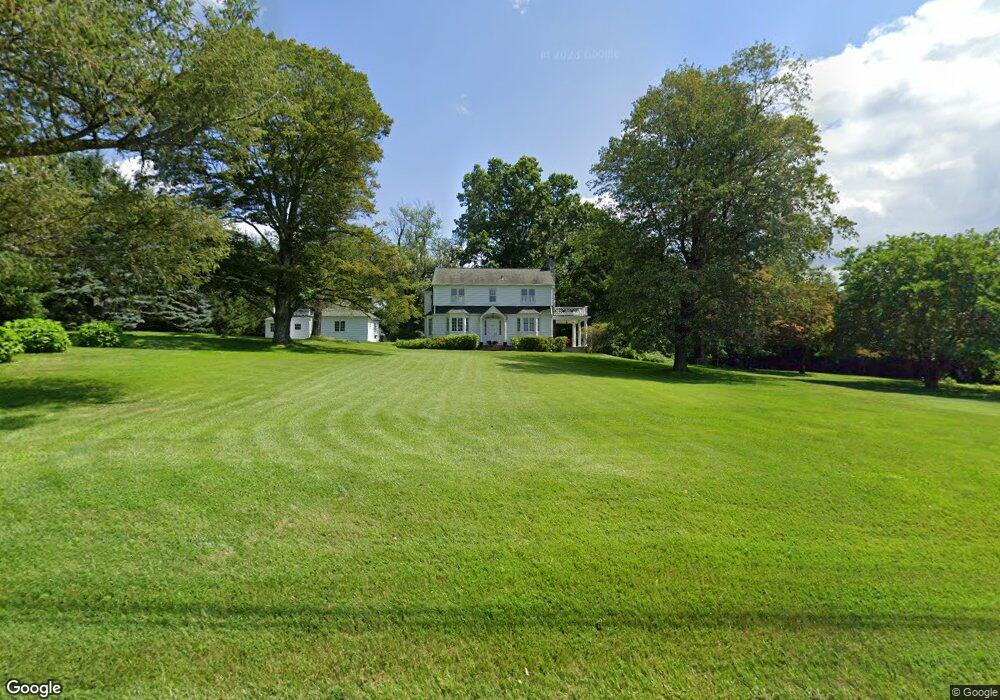
334 Main St S Bridgewater, CT 06752
Bridgewater AreaEstimated Value: $705,000 - $863,000
4
Beds
3
Baths
1,977
Sq Ft
$397/Sq Ft
Est. Value
About This Home
This home is located at 334 Main St S, Bridgewater, CT 06752 and is currently estimated at $784,762, approximately $396 per square foot. 334 Main St S is a home located in Litchfield County with nearby schools including Shepaug Valley School.
Create a Home Valuation Report for This Property
The Home Valuation Report is an in-depth analysis detailing your home's value as well as a comparison with similar homes in the area
Home Values in the Area
Average Home Value in this Area
Tax History
We collect this data history from publicly available records. To have your information removed, we recommend requesting removal directly through your county’s website.
| Year | Tax Paid | Tax Assessment Tax Assessment Total Assessment is a certain percentage of the fair market value that is determined by local assessors to be the total taxable value of land and additions on the property. | Land | Improvement |
|---|---|---|---|---|
| 2025 | $7,691 | $404,800 | $202,600 | $202,200 |
| 2024 | $7,185 | $404,800 | $202,600 | $202,200 |
| 2023 | $6,780 | $404,800 | $202,600 | $202,200 |
| 2022 | $6,808 | $368,000 | $241,400 | $126,600 |
| 2021 | $6,440 | $368,000 | $241,400 | $126,600 |
| 2020 | $6,440 | $368,000 | $241,400 | $126,600 |
| 2019 | $6,440 | $368,000 | $241,400 | $126,600 |
| 2018 | $6,330 | $368,000 | $241,400 | $126,600 |
| 2017 | $6,330 | $368,000 | $241,400 | $126,600 |
| 2016 | $7,397 | $428,800 | $274,900 | $153,900 |
| 2015 | $7,397 | $428,800 | $274,900 | $153,900 |
| 2014 | $7,397 | $428,800 | $274,900 | $153,900 |
Source: Public Records
Map
Nearby Homes
- 34 Black Snake Ln
- 16 Blueberry Hill Rd
- 31 Blueberry Hill Rd
- 190 Blueberry Hill Rd
- 197 Skyline Ridge Rd
- 62 Riverford Rd
- 289 Northrop St
- 49 Old Bridge Rd
- 13 Nicoles Ct
- 3 Deerfield Rd
- 3 Morrissey Ln
- 4 Judge Rd
- 20 Puritan Valley Rd
- 9 Hidden Brook Dr
- 18 Hearthstone Dr
- 21 Hearthstone Dr
- 28 Rock Cut Rd
- 3 Lillinonah Ridge Dr
- 48 Hop Brook Rd
- 13 Rajcula Farm Rd
Your Personal Tour Guide
Ask me questions while you tour the home.