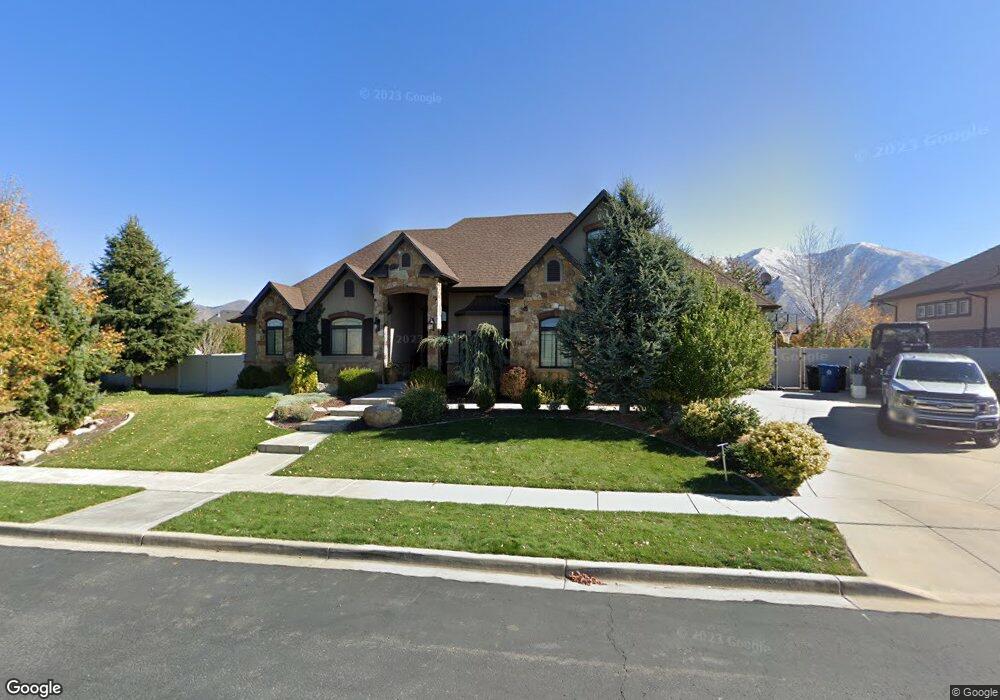
334 N 1360 E Spanish Fork, UT 84660
Estimated Value: $644,000 - $1,000,761
4
Beds
5
Baths
2,761
Sq Ft
$304/Sq Ft
Est. Value
About This Home
This home is located at 334 N 1360 E, Spanish Fork, UT 84660 and is currently estimated at $840,440, approximately $304 per square foot. 334 N 1360 E is a home located in Utah County with nearby schools including Sierra Bonita Elementary School, Mapleton Junior High School, and Maple Mountain High School.
Ownership History
Date
Name
Owned For
Owner Type
Purchase Details
Closed on
Aug 28, 2025
Sold by
Justensen Clayton Dean and Justensen Krista E
Bought by
Clayton Dean Justensen And Krista Eleanor Jus and Justensen
Current Estimated Value
Purchase Details
Closed on
Jul 2, 2025
Sold by
Justensen Clayton Dean and Justensen Krista E
Bought by
Clayton Dean Justensen And Krista Eleanor Jus and Justensen
Purchase Details
Closed on
Mar 13, 2007
Sold by
Justensen Clayton Dean and Justensen Krista E
Bought by
Justensen Clayton Dean and Justensen Krista E
Home Financials for this Owner
Home Financials are based on the most recent Mortgage that was taken out on this home.
Original Mortgage
$400,000
Interest Rate
6.29%
Mortgage Type
New Conventional
Purchase Details
Closed on
Jul 14, 2006
Sold by
Sunny Ridge Llc
Bought by
Justensen Clayton Dean and Justensen Krista E
Home Financials for this Owner
Home Financials are based on the most recent Mortgage that was taken out on this home.
Original Mortgage
$88,200
Interest Rate
6.57%
Mortgage Type
Purchase Money Mortgage
Create a Home Valuation Report for This Property
The Home Valuation Report is an in-depth analysis detailing your home's value as well as a comparison with similar homes in the area
Home Values in the Area
Average Home Value in this Area
Purchase History
| Date | Buyer | Sale Price | Title Company |
|---|---|---|---|
| Clayton Dean Justensen And Krista Eleanor Jus | -- | None Listed On Document | |
| Clayton Dean Justensen And Krista Eleanor Jus | -- | None Listed On Document | |
| Justensen Clayton Dean | -- | Title One | |
| Justensen Clayton Dean | -- | Pro Title & Escrow Inc |
Source: Public Records
Mortgage History
| Date | Status | Borrower | Loan Amount |
|---|---|---|---|
| Previous Owner | Justensen Clayton Dean | $400,000 | |
| Previous Owner | Justensen Clayton Dean | $88,200 |
Source: Public Records
Tax History
| Year | Tax Paid | Tax Assessment Tax Assessment Total Assessment is a certain percentage of the fair market value that is determined by local assessors to be the total taxable value of land and additions on the property. | Land | Improvement |
|---|---|---|---|---|
| 2025 | $4,290 | $502,150 | -- | -- |
| 2024 | $4,290 | $442,200 | $0 | $0 |
| 2023 | $4,396 | $453,585 | $0 | $0 |
| 2022 | $4,402 | $445,500 | $0 | $0 |
| 2021 | $3,892 | $630,200 | $155,800 | $474,400 |
| 2020 | $3,133 | $493,200 | $141,600 | $351,600 |
| 2019 | $2,907 | $481,400 | $132,700 | $348,700 |
| 2018 | $2,769 | $443,300 | $121,400 | $321,900 |
| 2017 | $2,807 | $241,560 | $0 | $0 |
| 2016 | $2,468 | $209,550 | $0 | $0 |
| 2015 | $2,259 | $189,475 | $0 | $0 |
| 2014 | $2,214 | $186,395 | $0 | $0 |
Source: Public Records
Map
Nearby Homes
- 2672 E 360 N Unit MRVL09
- 2622 E 360 N Unit MRVL07
- 1391 E 290 N
- 1005 E 260 N Unit 20
- 1022 E 360 N Unit 27
- 991 E 360 N Unit 8
- 1495 E 400 N
- 998 E 260 N Unit 16
- 992 E 260 N Unit 15
- 1261 E 680 N
- 136 N 1120 E
- 306 N 1070 E
- 306 N 1070 E Unit 17
- 274 N 1070 E Unit 14
- 299 N 1070 E
- 299 N 1070 E Unit 8
- 212 N 1070 E Unit 9
- 224 N 1070 E Unit 10
- 1455 E 100 S
- 284 N 1000 E
Your Personal Tour Guide
Ask me questions while you tour the home.