335 Copeland St Quincy, MA 02169
South Quincy NeighborhoodEstimated Value: $767,000 - $846,000
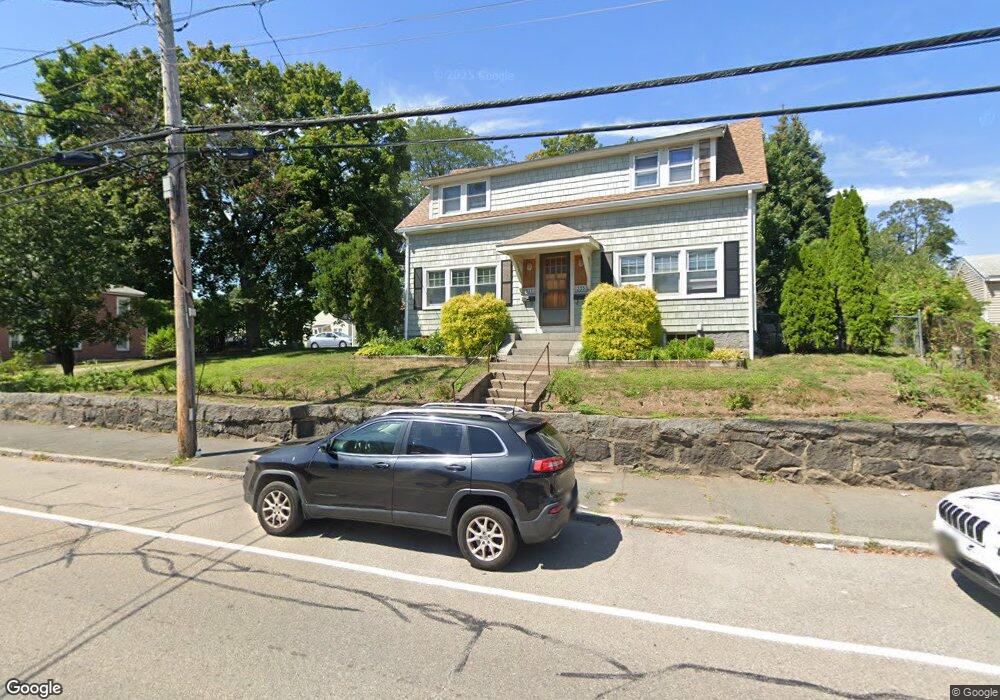
About This Home
This home is located at 335 Copeland St, Quincy, MA 02169 and is currently estimated at $817,895, approximately $401 per square foot. 335 Copeland St is a home located in Norfolk County with nearby schools including South West Middle School, Lincoln-Hancock Community School, and Quincy High School.
Ownership History
We collect this data history from publicly available records. To have your information removed, we recommend requesting removal directly through your county’s website.
Purchase Details
Home Financials for this Owner
Home Financials are based on the most recent Mortgage that was taken out on this home.Purchase Details
Home Financials for this Owner
Home Financials are based on the most recent Mortgage that was taken out on this home.Home Values in the Area
Average Home Value in this Area
Purchase History
We collect this data history from publicly available records. To have your information removed, we recommend requesting removal directly through your county’s website.
| Date | Buyer | Sale Price | Title Company |
|---|---|---|---|
| $260,000 | -- | ||
| $260,000 | -- | ||
| $145,000 | -- |
Mortgage History
We collect this data history from publicly available records. To have your information removed, we recommend requesting removal directly through your county’s website.
| Date | Status | Borrower | Loan Amount |
|---|---|---|---|
| Open | $208,000 | ||
| Closed | $208,000 | ||
| Previous Owner | $100,000 | ||
| Previous Owner | $145,000 |
Tax History
We collect this data history from publicly available records. To have your information removed, we recommend requesting removal directly through your county’s website.
| Year | Tax Paid | Tax Assessment Tax Assessment Total Assessment is a certain percentage of the fair market value that is determined by local assessors to be the total taxable value of land and additions on the property. | Land | Improvement |
|---|---|---|---|---|
| 2025 | $8,533 | $740,100 | $317,600 | $422,500 |
| 2024 | $8,005 | $710,300 | $302,800 | $407,500 |
| 2023 | $7,611 | $683,800 | $288,700 | $395,100 |
| 2022 | $7,242 | $604,500 | $232,000 | $372,500 |
| 2021 | $6,741 | $555,300 | $232,000 | $323,300 |
| 2020 | $6,902 | $555,300 | $232,000 | $323,300 |
| 2019 | $6,560 | $522,700 | $225,500 | $297,200 |
| 2018 | $6,613 | $495,700 | $209,200 | $286,500 |
| 2017 | $6,214 | $438,500 | $199,500 | $239,000 |
| 2016 | $5,698 | $396,800 | $181,900 | $214,900 |
| 2015 | $5,624 | $385,200 | $171,900 | $213,300 |
| 2014 | $5,082 | $342,000 | $171,900 | $170,100 |
Map
- 328 Copeland St Unit 2D
- 230 Willard St Unit 602
- 211 Copeland St
- 20 Miller St Unit 2
- 46 Lyons St Unit 46
- 40 Lyons St
- 166 Suomi Rd
- 159 Willard St Unit 7
- 30 Tinson Rd
- 308 Quarry St Unit 405
- 141 Willard St Unit 8
- 580 Quarry St Unit 4
- 580 Quarry St Unit 18
- 31 Station St
- 95 & 97 Copeland St
- 211 West St Unit 11B
- 211 West St Unit 4B
- 211 West St Unit 12B
- 114 Bunker Hill Ln
- 115 Bunker Hill Ln
- 329 Copeland St
- 116 Crescent St
- 116 Crescent St
- 122 Crescent St
- 351 Copeland St
- 327 Copeland St
- 108 Crescent St
- 349 Copeland St
- 128 Crescent St
- 128 Crescent St Unit 3
- 104 Crescent St
- 321 Copeland St
- 355 Copeland St
- 102 Crescent St
- 136 Crescent St
- 352 Copeland St
- 328 Copeland St Unit 1B
- 328 Copeland St Unit 2E
- 328 Copeland St Unit 2A
- 328 Copeland St Unit 1D
Ask me questions while you tour the home.