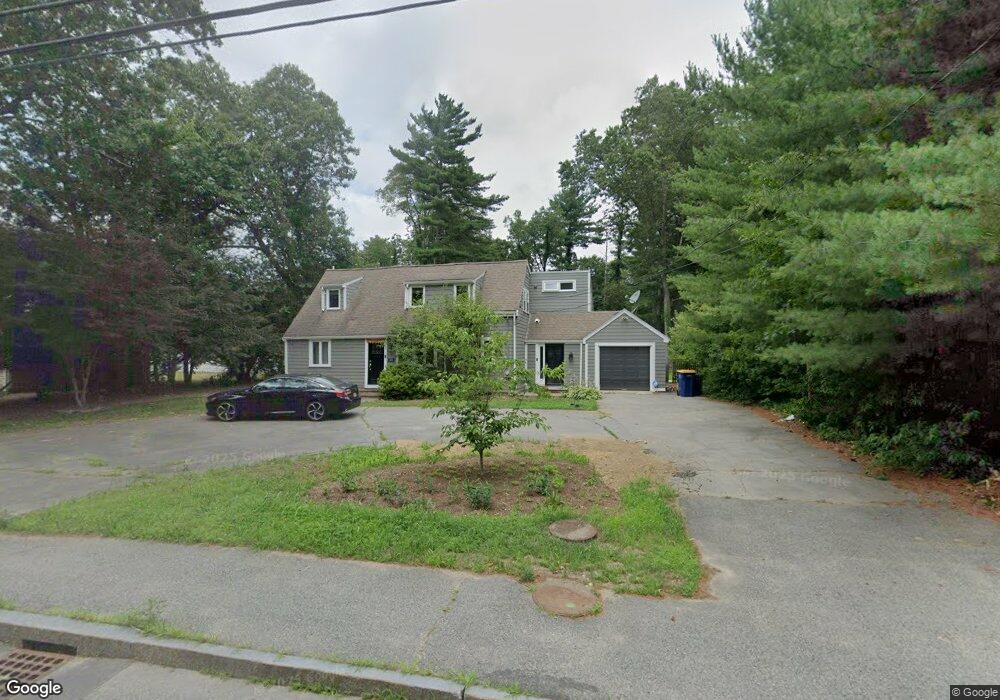
335 S Main St Unit 1 Sharon, MA 02067
Estimated Value: $690,000 - $952,737
About This Home
This home is located at 335 S Main St Unit 1, Sharon, MA 02067 and is currently estimated at $840,184, approximately $308 per square foot. 335 S Main St Unit 1 is a home located in Norfolk County with nearby schools including Heights Elementary School, Sharon Middle School, and Sharon High School.
Ownership History
We collect this data history from publicly available records. To have your information removed, we recommend requesting removal directly through your county’s website.
Purchase Details
Home Financials for this Owner
Home Financials are based on the most recent Mortgage that was taken out on this home.Purchase Details
Home Financials for this Owner
Home Financials are based on the most recent Mortgage that was taken out on this home.Purchase Details
Home Financials for this Owner
Home Financials are based on the most recent Mortgage that was taken out on this home.Home Values in the Area
Average Home Value in this Area
Purchase History
We collect this data history from publicly available records. To have your information removed, we recommend requesting removal directly through your county’s website.
| Date | Buyer | Sale Price | Title Company |
|---|---|---|---|
| $745,000 | None Available | ||
| $370,000 | -- | ||
| $370,000 | -- | ||
| $201,100 | -- | ||
| $201,100 | -- |
Mortgage History
We collect this data history from publicly available records. To have your information removed, we recommend requesting removal directly through your county’s website.
| Date | Status | Borrower | Loan Amount |
|---|---|---|---|
| Open | $707,750 | ||
| Previous Owner | $34,700 | ||
| Previous Owner | $296,000 | ||
| Previous Owner | $160,800 |
Tax History
We collect this data history from publicly available records. To have your information removed, we recommend requesting removal directly through your county’s website.
| Year | Tax Paid | Tax Assessment Tax Assessment Total Assessment is a certain percentage of the fair market value that is determined by local assessors to be the total taxable value of land and additions on the property. | Land | Improvement |
|---|---|---|---|---|
| 2025 | $12,087 | $691,500 | $400,000 | $291,500 |
| 2024 | $11,576 | $658,500 | $367,000 | $291,500 |
| 2023 | $11,357 | $610,900 | $343,100 | $267,800 |
| 2022 | $10,701 | $541,800 | $285,900 | $255,900 |
| 2021 | $10,595 | $518,600 | $269,800 | $248,800 |
| 2020 | $9,853 | $518,600 | $269,800 | $248,800 |
| 2019 | $9,464 | $487,600 | $238,800 | $248,800 |
| 2018 | $9,352 | $482,800 | $234,000 | $248,800 |
| 2017 | $9,170 | $467,400 | $218,600 | $248,800 |
| 2016 | $8,969 | $446,000 | $218,600 | $227,400 |
| 2015 | $8,646 | $425,900 | $200,500 | $225,400 |
| 2014 | $8,064 | $392,400 | $182,300 | $210,100 |
Map
- 21 Clarke St
- 6 Sandy Ridge Cir
- 22 Middlesex Rd
- 7 Marie Ave
- 10 Roberta Rd
- 133 Pond St
- 58 Ames St
- 2 East St
- 10 Pine Rd
- 17 Pond St
- 50 Arboro Dr
- 6 Osprey Rd
- 18 Terrapin Ln
- 4 Knife Shop Ln
- 162 East St
- 48 Spring Ln
- 180 Old Post Rd Unit 203
- 180 Old Post Rd Unit 206
- 180 Old Post Rd Unit 204
- 180 Old Post Rd Unit 207
Ask me questions while you tour the home.