336 E North St Wooster, OH 44691
Estimated Value: $122,000 - $186,000
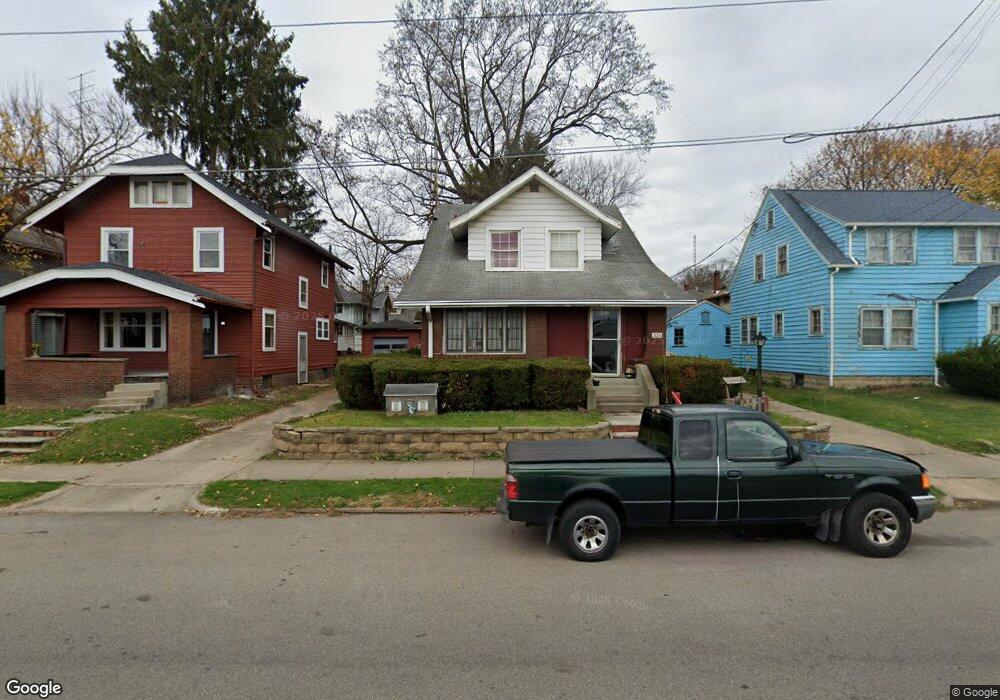
About This Home
This home is located at 336 E North St, Wooster, OH 44691 and is currently estimated at $145,932, approximately $93 per square foot. 336 E North St is a home located in Wayne County with nearby schools including Cornerstone Elementary School, Edgewood Middle School, and Wooster High School.
Ownership History
We collect this data history from publicly available records. To have your information removed, we recommend requesting removal directly through your county’s website.
Purchase Details
Home Financials for this Owner
Home Financials are based on the most recent Mortgage that was taken out on this home.Purchase Details
Home Values in the Area
Average Home Value in this Area
Purchase History
We collect this data history from publicly available records. To have your information removed, we recommend requesting removal directly through your county’s website.
| Date | Buyer | Sale Price | Title Company |
|---|---|---|---|
| $70,000 | -- | ||
| $54,000 | -- |
Mortgage History
We collect this data history from publicly available records. To have your information removed, we recommend requesting removal directly through your county’s website.
| Date | Status | Borrower | Loan Amount |
|---|---|---|---|
| Open | $66,500 |
Tax History
We collect this data history from publicly available records. To have your information removed, we recommend requesting removal directly through your county’s website.
| Year | Tax Paid | Tax Assessment Tax Assessment Total Assessment is a certain percentage of the fair market value that is determined by local assessors to be the total taxable value of land and additions on the property. | Land | Improvement |
|---|---|---|---|---|
| 2025 | $1,486 | $35,910 | $7,450 | $28,460 |
| 2024 | $1,486 | $35,910 | $7,450 | $28,460 |
| 2023 | $1,492 | $35,910 | $7,450 | $28,460 |
| 2022 | $1,331 | $25,460 | $5,280 | $20,180 |
| 2021 | $1,373 | $25,460 | $5,280 | $20,180 |
| 2020 | $1,302 | $25,460 | $5,280 | $20,180 |
| 2019 | $1,237 | $23,220 | $6,100 | $17,120 |
| 2018 | $1,240 | $23,220 | $6,100 | $17,120 |
| 2017 | $1,233 | $23,220 | $6,100 | $17,120 |
| 2016 | $1,288 | $22,330 | $5,870 | $16,460 |
| 2015 | $1,328 | $22,330 | $5,870 | $16,460 |
| 2014 | $1,297 | $22,330 | $5,870 | $16,460 |
| 2013 | $1,587 | $26,360 | $6,310 | $20,050 |
Map
- 535 E North St
- 431 College Ave
- 423 N Market St
- 523 College Ave
- 412 Spink St
- 329 E Bowman St
- 637 Quinby Ave
- 708 N Bever St
- 369 W North St
- 708 E Bowman St
- 120 Ohio St
- 211 W Vine St
- 513 Washington St
- 487 Woodland Ave
- 900 Quinby Ave
- 630 Saybolt Ave
- 851 Park Blvd
- 935 Washington St
- 972 Washington St
- 1031 Washington St
Ask me questions while you tour the home.