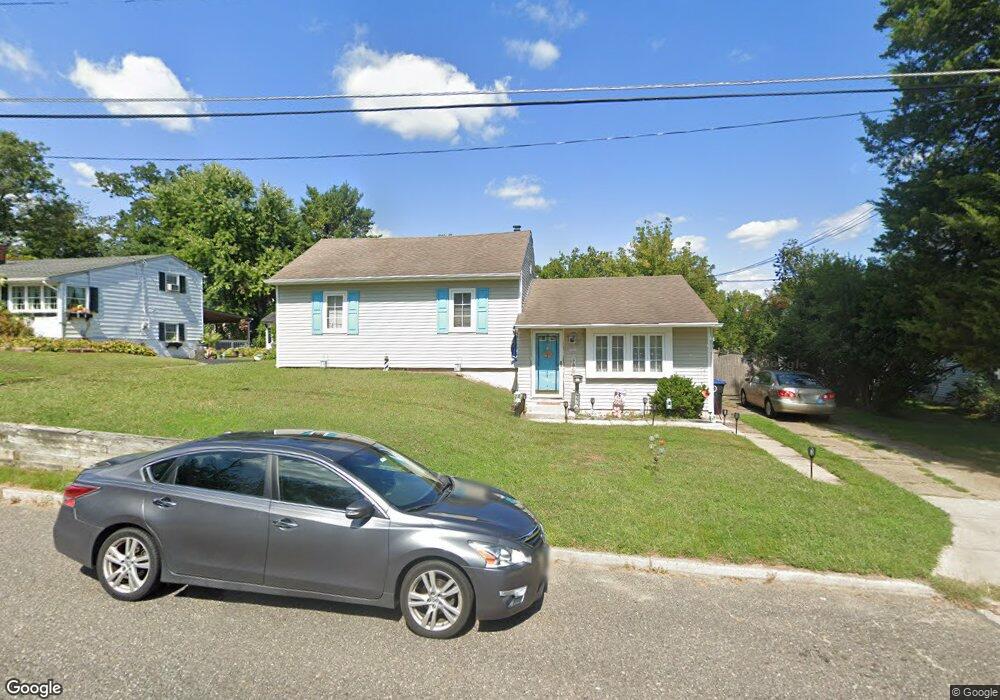
337 3rd Ave Lindenwold, NJ 08021
Estimated Value: $254,000 - $292,000
Studio
--
Bath
988
Sq Ft
$274/Sq Ft
Est. Value
About This Home
This home is located at 337 3rd Ave, Lindenwold, NJ 08021 and is currently estimated at $270,328, approximately $273 per square foot. 337 3rd Ave is a home located in Camden County with nearby schools including Lindenwold High School, South Jersey Sudbury School, and Trinity Preparatory School Inc..
Ownership History
Date
Name
Owned For
Owner Type
Purchase Details
Closed on
Jan 20, 2006
Sold by
Reilly Joseph J
Bought by
Minchin George and Minchin Rosemarie
Current Estimated Value
Home Financials for this Owner
Home Financials are based on the most recent Mortgage that was taken out on this home.
Original Mortgage
$116,000
Outstanding Balance
$65,355
Interest Rate
6.31%
Estimated Equity
$204,973
Purchase Details
Closed on
Aug 22, 2000
Sold by
Clayton Mark
Bought by
Reilly Joseph J and Masch Jill C
Home Financials for this Owner
Home Financials are based on the most recent Mortgage that was taken out on this home.
Original Mortgage
$79,400
Interest Rate
8%
Mortgage Type
FHA
Create a Home Valuation Report for This Property
The Home Valuation Report is an in-depth analysis detailing your home's value as well as a comparison with similar homes in the area
Home Values in the Area
Average Home Value in this Area
Purchase History
We collect this data history from publicly available records. To have your information removed, we recommend requesting removal directly through your county’s website.
| Date | Buyer | Sale Price | Title Company |
|---|---|---|---|
| Minchin George | $161,000 | -- | |
| Reilly Joseph J | $79,500 | -- |
Source: Public Records
Mortgage History
We collect this data history from publicly available records. To have your information removed, we recommend requesting removal directly through your county’s website.
| Date | Status | Borrower | Loan Amount |
|---|---|---|---|
| Open | Minchin George | $116,000 | |
| Previous Owner | Reilly Joseph J | $79,400 |
Source: Public Records
Tax History
| Year | Tax Paid | Tax Assessment Tax Assessment Total Assessment is a certain percentage of the fair market value that is determined by local assessors to be the total taxable value of land and additions on the property. | Land | Improvement |
|---|---|---|---|---|
| 2025 | $5,428 | $109,200 | $37,500 | $71,700 |
| 2024 | $5,429 | $109,200 | $37,500 | $71,700 |
| 2023 | $5,429 | $109,200 | $37,500 | $71,700 |
| 2022 | $5,424 | $109,200 | $37,500 | $71,700 |
| 2021 | $5,574 | $109,200 | $37,500 | $71,700 |
| 2020 | $5,541 | $109,200 | $37,500 | $71,700 |
| 2019 | $5,590 | $109,200 | $37,500 | $71,700 |
| 2018 | $5,576 | $109,200 | $37,500 | $71,700 |
| 2017 | $5,409 | $109,200 | $37,500 | $71,700 |
| 2016 | $5,287 | $109,200 | $37,500 | $71,700 |
| 2015 | $5,065 | $109,200 | $37,500 | $71,700 |
| 2014 | $4,844 | $109,200 | $37,500 | $71,700 |
Source: Public Records
Map
Nearby Homes
- 428 6th Ave
- 700 Central Ave
- 113 1st Ave
- 113 Lake Blvd
- 315 W Atlantic Ave
- 583 Lake Blvd
- 514 Park Ave
- 649 6th Ave
- 703 Sycamore Ct
- 195 Chews Landing Rd
- 217 W Maple Ave
- 117 State Ave
- 1802 Greenwood Dr
- 2004 Greenwood Dr
- 57 Dover Dr
- 2005 Greenwood Dr
- 1910 Greenwood Dr
- 35 Harwood Ln
- 502 W Laurel Rd
- 43 Harwood Ln Unit BB
Your Personal Tour Guide
Ask me questions while you tour the home.