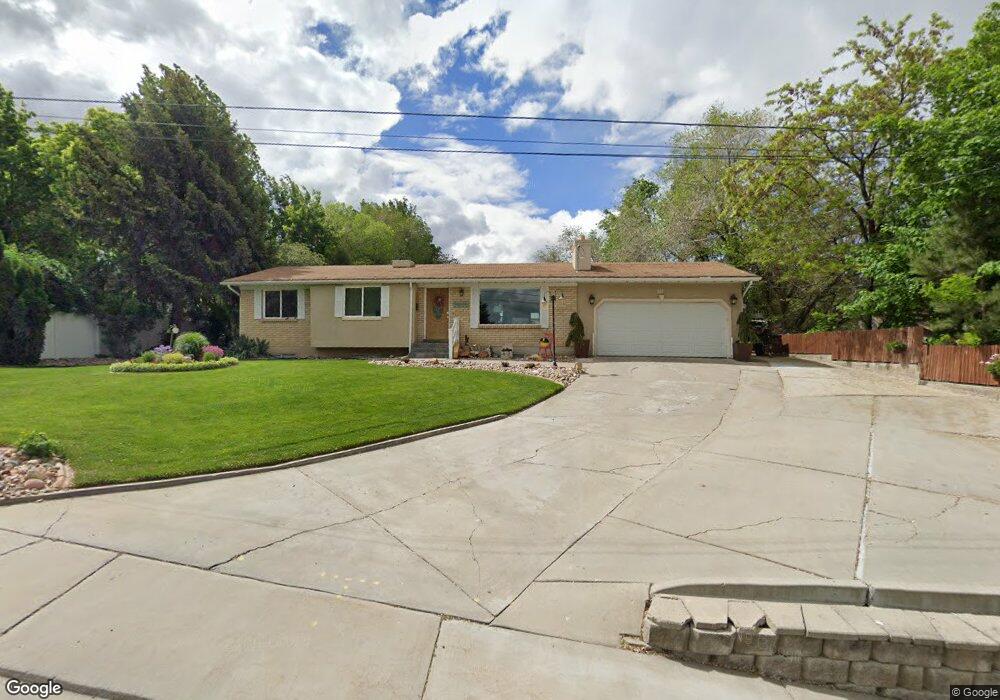
337 W 600 S Payson, UT 84651
Estimated Value: $491,710 - $524,000
3
Beds
2
Baths
1,530
Sq Ft
$328/Sq Ft
Est. Value
About This Home
This home is located at 337 W 600 S, Payson, UT 84651 and is currently estimated at $502,428, approximately $328 per square foot. 337 W 600 S is a home located in Utah County with nearby schools including Wilson Elementary School, Payson Junior High School, and Mt. Nebo Middle.
Ownership History
Date
Name
Owned For
Owner Type
Purchase Details
Closed on
Oct 28, 2008
Sold by
Houser N Kay and Houser Lynett H
Bought by
Houser N Kay and Houser Lynette H
Current Estimated Value
Purchase Details
Closed on
Apr 21, 2008
Sold by
Houser N Kay and Houser Lynette H
Bought by
Houser N Kay and Houser Lynette H
Purchase Details
Closed on
Jan 9, 2008
Sold by
Houser N Kay and Houser Lynette H
Bought by
Houser N Kay and Houser Lynette H
Purchase Details
Closed on
Jan 18, 2001
Sold by
White V Joel and White Patricia L
Bought by
Houser Aaron Kay and Houser April Yvonne
Create a Home Valuation Report for This Property
The Home Valuation Report is an in-depth analysis detailing your home's value as well as a comparison with similar homes in the area
Home Values in the Area
Average Home Value in this Area
Purchase History
| Date | Buyer | Sale Price | Title Company |
|---|---|---|---|
| Houser N Kay | -- | Accommodation | |
| Houser N Kay | -- | Accommodation | |
| Houser N Kay | -- | None Available | |
| Houser Aaron Kay | -- | -- |
Source: Public Records
Tax History
| Year | Tax Paid | Tax Assessment Tax Assessment Total Assessment is a certain percentage of the fair market value that is determined by local assessors to be the total taxable value of land and additions on the property. | Land | Improvement |
|---|---|---|---|---|
| 2025 | $228 | $274,340 | -- | -- |
| 2024 | $228 | $253,110 | $0 | $0 |
| 2023 | $601 | $256,410 | $0 | $0 |
| 2022 | $608 | $239,910 | $0 | $0 |
| 2021 | $495 | $319,200 | $100,400 | $218,800 |
| 2020 | $1,690 | $292,200 | $87,300 | $204,900 |
| 2019 | $1,650 | $266,500 | $75,400 | $191,100 |
| 2018 | $400 | $239,100 | $63,500 | $175,600 |
| 2017 | $361 | $118,580 | $0 | $0 |
| 2016 | $312 | $109,780 | $0 | $0 |
| 2015 | $367 | $104,335 | $0 | $0 |
| 2014 | $319 | $93,115 | $0 | $0 |
Source: Public Records
Map
Nearby Homes
Your Personal Tour Guide
Ask me questions while you tour the home.