Estimated Value: $283,000 - $386,020
5
Beds
2
Baths
3,420
Sq Ft
$99/Sq Ft
Est. Value
About This Home
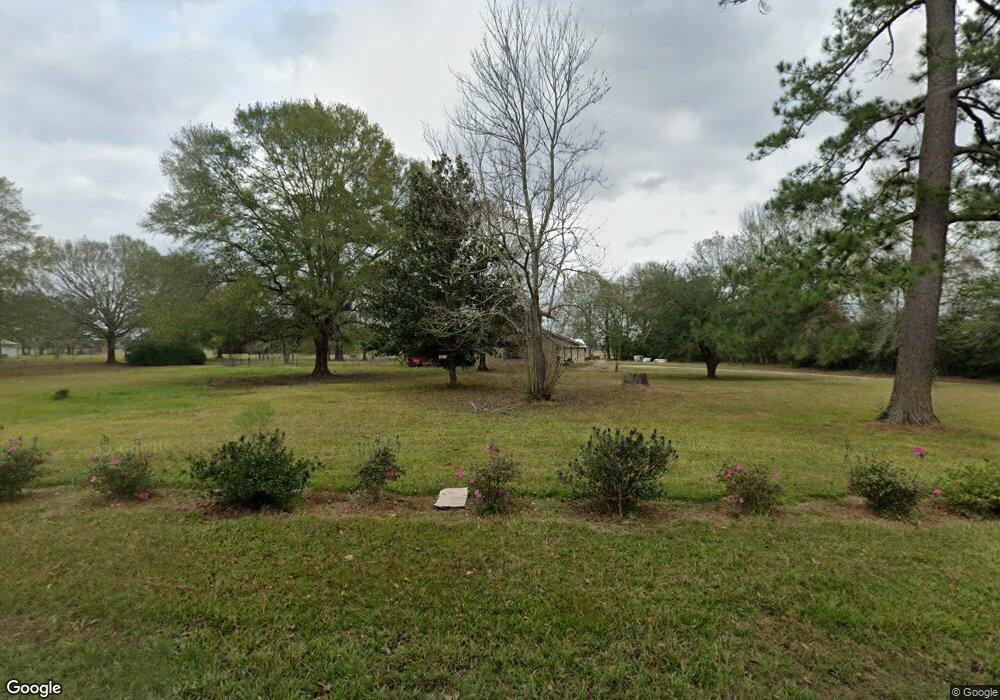
This home is located at 339 County Road 809 Unit off Caillier Loop FM, Buna, TX 77612 and is currently estimated at $339,505, approximately $99 per square foot. 339 County Road 809 Unit off Caillier Loop FM is a home located in Jasper County with nearby schools including Buna Elementary School, Buna Junior High School, and Buna High School.
Ownership History
Date
Name
Owned For
Owner Type
Purchase Details
Closed on
Nov 1, 2022
Sold by
Cherry Brianne Rene
Bought by
Cherry Jonah Mitchell
Current Estimated Value
Home Financials for this Owner
Home Financials are based on the most recent Mortgage that was taken out on this home.
Original Mortgage
$170,000
Outstanding Balance
$162,962
Interest Rate
6.02%
Mortgage Type
Credit Line Revolving
Estimated Equity
$176,543
Purchase Details
Closed on
Nov 18, 2015
Sold by
Lummus Holly H and West Holly J
Bought by
Cherry Jopnah M
Home Financials for this Owner
Home Financials are based on the most recent Mortgage that was taken out on this home.
Original Mortgage
$162,001
Interest Rate
3.79%
Mortgage Type
Purchase Money Mortgage
Purchase Details
Closed on
Nov 25, 2008
Sold by
Jones Shon and Jones Christy
Bought by
Lummus Holly J
Create a Home Valuation Report for This Property
The Home Valuation Report is an in-depth analysis detailing your home's value as well as a comparison with similar homes in the area
Purchase History
| Date | Buyer | Sale Price | Title Company |
|---|---|---|---|
| Cherry Jonah Mitchell | -- | Capital Title | |
| Cherry Jonah Mitchell | -- | Capital Title | |
| Cherry Jopnah M | -- | None Available | |
| Cherry Jopnah M | -- | None Available | |
| Lummus Holly J | $161,224 | None Available | |
| Lummus Holly J | $161,224 | None Available |
Source: Public Records
Mortgage History
| Date | Status | Borrower | Loan Amount |
|---|---|---|---|
| Open | Cherry Jonah Mitchell | $170,000 | |
| Previous Owner | Cherry Jopnah M | $162,001 |
Source: Public Records
Tax History
| Year | Tax Paid | Tax Assessment Tax Assessment Total Assessment is a certain percentage of the fair market value that is determined by local assessors to be the total taxable value of land and additions on the property. | Land | Improvement |
|---|---|---|---|---|
| 2025 | $4,305 | $378,127 | $57,751 | $320,376 |
| 2024 | $61 | $377,987 | $60,884 | $317,103 |
| 2023 | $5,517 | $356,506 | $52,490 | $304,016 |
| 2022 | $5,558 | $290,798 | $35,863 | $254,935 |
| 2021 | $5,160 | $267,149 | $36,746 | $230,403 |
| 2020 | $4,860 | $233,625 | $30,420 | $203,205 |
| 2019 | $4,629 | $212,410 | $29,218 | $183,192 |
| 2018 | $4,059 | $186,368 | $24,340 | $162,028 |
| 2017 | $4,059 | $186,368 | $24,340 | $162,028 |
| 2016 | $4,062 | $186,368 | $24,340 | $162,028 |
| 2015 | -- | $177,028 | $15,000 | $162,028 |
| 2014 | -- | $177,028 | $15,000 | $162,028 |
Source: Public Records
Map
Nearby Homes
- 2146 Fm 2938 Rd
- 1885 Fm 2938 Rd
- 237 Private Road 8101
- 1056 Fm 2938 Rd
- 00 County Road 616
- 161 County Road 819
- 33847 US Hwy 96 S
- 33847 US Highway 96 S
- 1428 Fm 253 Rd
- 314 County Road 804
- 275 Cr 734
- 1466 Texas 62
- 582 County Road 814
- 631 Fm 253 Rd
- 0 Farm To Market 253
- 147 County Road 817
- 362 County Rd
- 3308 County Road 3114
- 375 Cr 725
- 375 County Road 725
- 339 Cr 809 Unit off Caillier Loop
- 339 Cr 809
- 339 County Road 809
- 339 County Road 809 Unit off Caillier Loop
- 265 County Road 809
- 280 County Road 809
- 340 County Road 809
- 250 County Road 809
- 250 County Road 809 Unit Off Callier Loop
- 2191 Fm 2938 Rd
- 187 Private Road 8102
- 149 Private Road 8102
- 186 Private Road 8102
- 2305 Fm 2938 Rd
- 129 County Road 809
- 129 County Road 809 Unit Caillier Loop
- 190 County Road 809
- 2439 Fm 2938 Rd
- 148 Private Road 8102
- 2159 Fm 2938 Rd
Your Personal Tour Guide
Ask me questions while you tour the home.