339 Swift Ave Osterville, MA 02655
Osterville NeighborhoodEstimated Value: $786,000 - $1,062,000
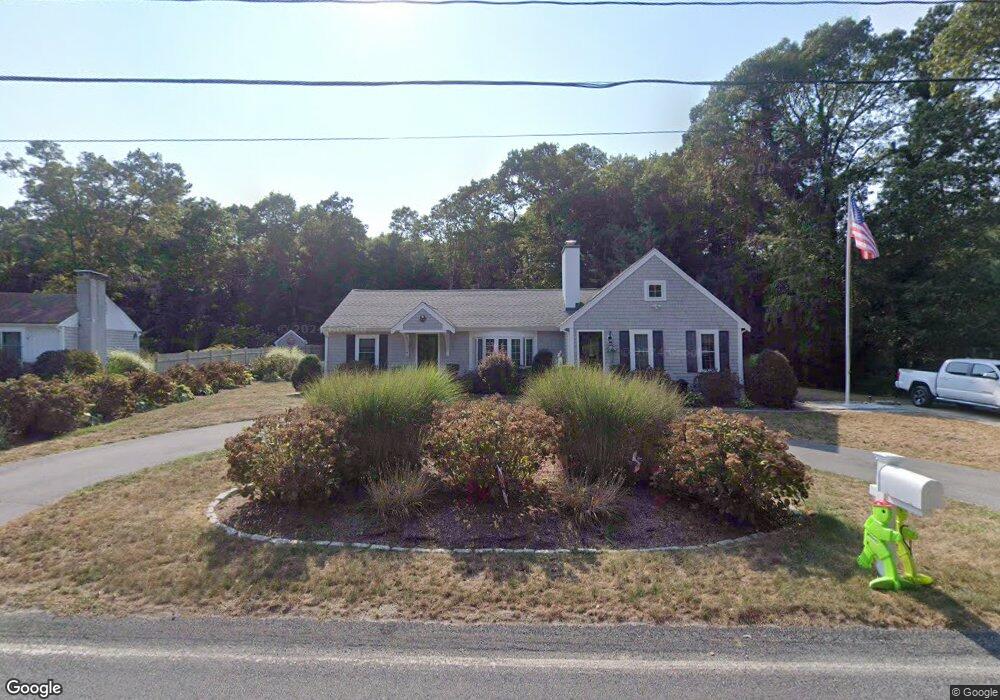
About This Home
This home is located at 339 Swift Ave, Osterville, MA 02655 and is currently estimated at $900,124, approximately $1,203 per square foot. 339 Swift Ave is a home located in Barnstable County with nearby schools including Barnstable United Elementary School, West Villages Elementary School, and Barnstable Intermediate School.
Ownership History
We collect this data history from publicly available records. To have your information removed, we recommend requesting removal directly through your county’s website.
Purchase Details
Home Financials for this Owner
Home Financials are based on the most recent Mortgage that was taken out on this home.Purchase Details
Home Values in the Area
Average Home Value in this Area
Purchase History
We collect this data history from publicly available records. To have your information removed, we recommend requesting removal directly through your county’s website.
| Date | Buyer | Sale Price | Title Company |
|---|---|---|---|
| $297,500 | -- | ||
| $250,000 | -- |
Mortgage History
We collect this data history from publicly available records. To have your information removed, we recommend requesting removal directly through your county’s website.
| Date | Status | Borrower | Loan Amount |
|---|---|---|---|
| Open | $52,500 | ||
| Open | $228,000 | ||
| Closed | $231,700 | ||
| Closed | $100,000 | ||
| Closed | $44,625 |
Tax History
We collect this data history from publicly available records. To have your information removed, we recommend requesting removal directly through your county’s website.
| Year | Tax Paid | Tax Assessment Tax Assessment Total Assessment is a certain percentage of the fair market value that is determined by local assessors to be the total taxable value of land and additions on the property. | Land | Improvement |
|---|---|---|---|---|
| 2025 | $6,195 | $765,800 | $332,100 | $433,700 |
| 2024 | $5,949 | $761,700 | $332,100 | $429,600 |
| 2023 | $5,695 | $682,800 | $308,700 | $374,100 |
| 2022 | $5,190 | $538,400 | $213,500 | $324,900 |
| 2021 | $5,255 | $501,000 | $233,800 | $267,200 |
| 2020 | $5,473 | $499,400 | $233,800 | $265,600 |
| 2019 | $5,419 | $480,400 | $243,900 | $236,500 |
| 2018 | $195 | $442,900 | $246,100 | $196,800 |
| 2017 | $3,548 | $329,700 | $246,100 | $83,600 |
| 2016 | $4,082 | $374,500 | $290,900 | $83,600 |
| 2015 | $3,049 | $281,000 | $192,500 | $88,500 |
Map
- 441 Old Mill Rd
- 20 Deerfield Rd
- 170 Sturbridge Dr
- 37 Old Salem Way
- 420 Starboard Ln
- 107 Parsley Ln
- 5 Briar Patch Rd
- 162 Main St
- 48 Starboard Ln
- 177 Bayview Cir
- 63 Main St
- 103 Falling Leaf Ln
- 31 Falling Leaf Ln
- 84 Hinckley Cir
- 442 Bay Ln
- 88 Waterfield Rd
- 5 Hinckley Cir
- 7 Bonnie Briar Rd
- 114 King Arthur Dr
- 31 Jasons Ln
- 329 Swift Ave
- 351 Swift Ave
- 480 Old Mill Rd
- 217 Sturbridge Dr
- 466 Old Mill Rd
- 460 Old Mill Rd
- 200 Sturbridge Dr
- 203 Sturbridge Dr
- 428 Old Mill Rd
- 10 Darby Way
- 450 Old Mill Rd
- 5 Darby Way
- 105 Newport Ln
- 64 Beach Plum Ln
- 499 Old Mill Rd
- 193 Sturbridge Dr
- 84 Newport Ln
- 50 Chardon Ln
- 18 Darby Way
- 15 Darby Way
Ask me questions while you tour the home.