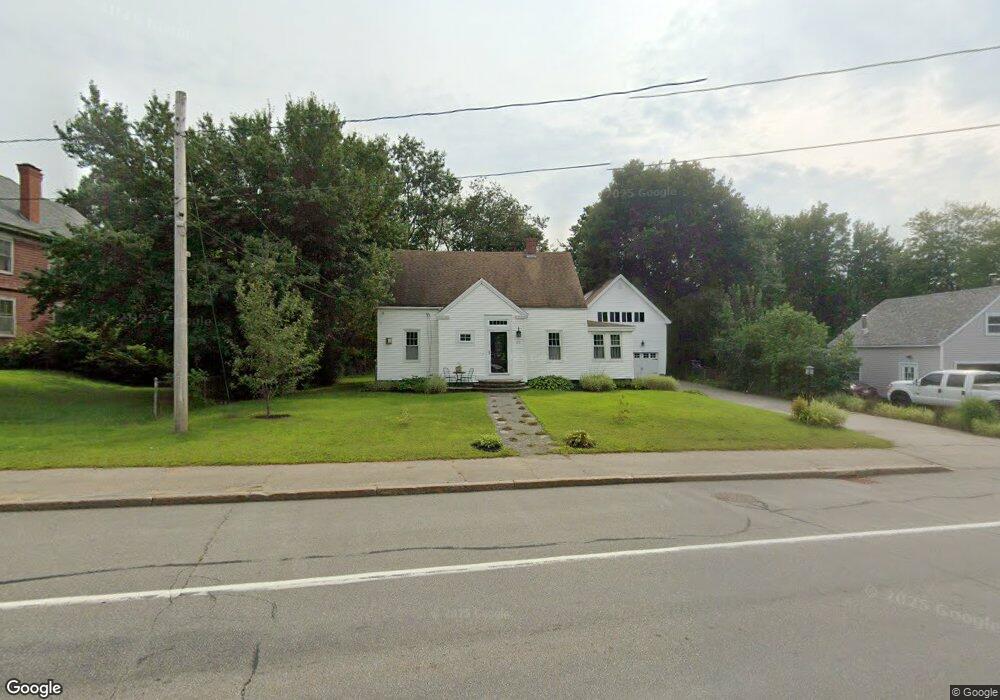
34 Allen St Berwick, ME 03901
Estimated Value: $433,752 - $540,000
3
Beds
2
Baths
1,924
Sq Ft
$251/Sq Ft
Est. Value
About This Home
This home is located at 34 Allen St, Berwick, ME 03901 and is currently estimated at $482,938, approximately $251 per square foot. 34 Allen St is a home located in York County with nearby schools including Noble High School and Tri-City Christian Academy.
Ownership History
Date
Name
Owned For
Owner Type
Purchase Details
Closed on
Feb 26, 2019
Sold by
Shisler Steven M
Bought by
Shisler Elizabeth E
Current Estimated Value
Home Financials for this Owner
Home Financials are based on the most recent Mortgage that was taken out on this home.
Original Mortgage
$175,000
Outstanding Balance
$152,282
Interest Rate
4.4%
Mortgage Type
New Conventional
Estimated Equity
$330,656
Create a Home Valuation Report for This Property
The Home Valuation Report is an in-depth analysis detailing your home's value as well as a comparison with similar homes in the area
Home Values in the Area
Average Home Value in this Area
Purchase History
| Date | Buyer | Sale Price | Title Company |
|---|---|---|---|
| Shisler Elizabeth E | -- | -- | |
| Shisler Elizabeth E | -- | -- | |
| Shisler Elizabeth E | -- | -- | |
| Shisler Elizabeth E | -- | -- |
Source: Public Records
Mortgage History
| Date | Status | Borrower | Loan Amount |
|---|---|---|---|
| Open | Shisler Elizabeth E | $175,000 | |
| Closed | Shisler Elizabeth E | $175,000 |
Source: Public Records
Tax History
| Year | Tax Paid | Tax Assessment Tax Assessment Total Assessment is a certain percentage of the fair market value that is determined by local assessors to be the total taxable value of land and additions on the property. | Land | Improvement |
|---|---|---|---|---|
| 2025 | $5,298 | $406,300 | $114,500 | $291,800 |
| 2024 | $5,067 | $406,300 | $114,500 | $291,800 |
| 2023 | $4,367 | $238,400 | $81,800 | $156,600 |
| 2022 | $4,344 | $238,400 | $81,800 | $156,600 |
| 2021 | $4,363 | $238,400 | $81,800 | $156,600 |
| 2020 | $3,779 | $238,400 | $81,800 | $156,600 |
| 2019 | $4,130 | $235,600 | $81,800 | $153,800 |
| 2018 | $3,634 | $211,900 | $73,800 | $138,100 |
| 2017 | $3,634 | $211,900 | $73,800 | $138,100 |
| 2016 | $3,454 | $211,900 | $73,800 | $138,100 |
| 2014 | $3,369 | $211,900 | $73,800 | $138,100 |
| 2013 | $3,401 | $211,900 | $73,800 | $138,100 |
Source: Public Records
Map
Nearby Homes
Your Personal Tour Guide
Ask me questions while you tour the home.