34 Apollo St Warwick, RI 02888
Spring Green NeighborhoodEstimated Value: $376,967 - $452,000
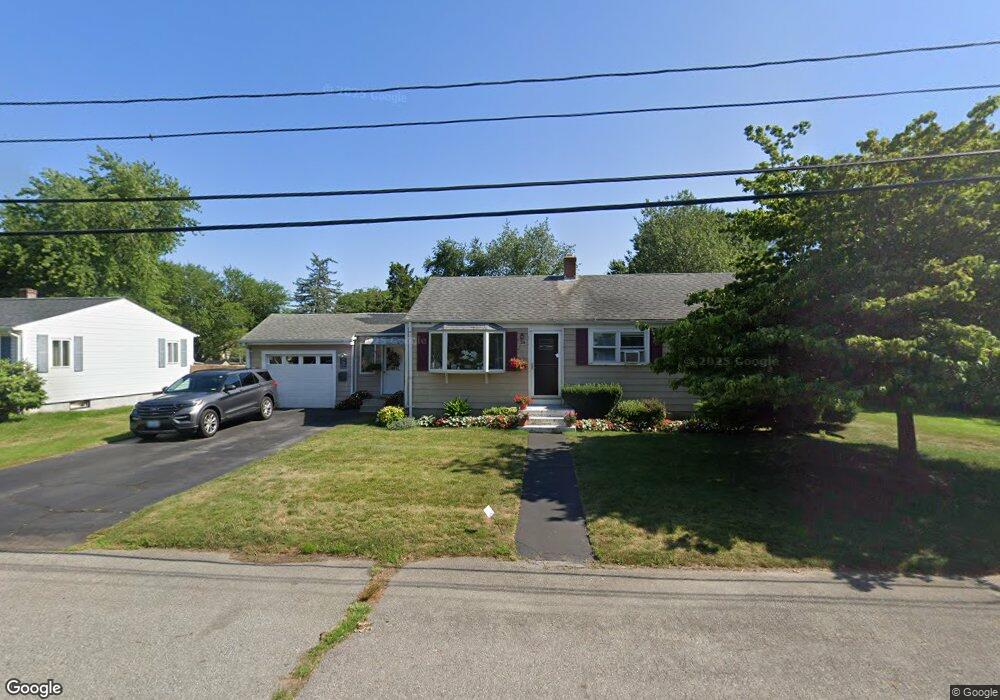
About This Home
This home is located at 34 Apollo St, Warwick, RI 02888 and is currently estimated at $412,742, approximately $289 per square foot. 34 Apollo St is a home located in Kent County with nearby schools including St. Peter School and Saint Kevin School.
Ownership History
We collect this data history from publicly available records. To have your information removed, we recommend requesting removal directly through your county’s website.
Purchase Details
Home Financials for this Owner
Home Financials are based on the most recent Mortgage that was taken out on this home.Home Values in the Area
Average Home Value in this Area
Purchase History
We collect this data history from publicly available records. To have your information removed, we recommend requesting removal directly through your county’s website.
| Date | Buyer | Sale Price | Title Company |
|---|---|---|---|
| $117,000 | -- |
Mortgage History
We collect this data history from publicly available records. To have your information removed, we recommend requesting removal directly through your county’s website.
| Date | Status | Borrower | Loan Amount |
|---|---|---|---|
| Open | $155,000 | ||
| Closed | $150,000 | ||
| Closed | $120,650 | ||
| Closed | $117,000 |
Tax History
We collect this data history from publicly available records. To have your information removed, we recommend requesting removal directly through your county’s website.
| Year | Tax Paid | Tax Assessment Tax Assessment Total Assessment is a certain percentage of the fair market value that is determined by local assessors to be the total taxable value of land and additions on the property. | Land | Improvement |
|---|---|---|---|---|
| 2025 | $4,409 | $347,200 | $116,500 | $230,700 |
| 2024 | $4,179 | $288,800 | $101,300 | $187,500 |
| 2023 | $4,098 | $288,800 | $101,300 | $187,500 |
| 2022 | $3,787 | $202,200 | $62,300 | $139,900 |
| 2021 | $3,787 | $202,200 | $62,300 | $139,900 |
| 2020 | $3,787 | $202,200 | $62,300 | $139,900 |
| 2019 | $3,787 | $202,200 | $62,300 | $139,900 |
| 2018 | $3,118 | $149,900 | $55,400 | $94,500 |
| 2017 | $3,034 | $149,900 | $55,400 | $94,500 |
| 2016 | $3,034 | $149,900 | $55,400 | $94,500 |
| 2015 | $3,196 | $154,000 | $68,200 | $85,800 |
| 2014 | $3,089 | $154,000 | $68,200 | $85,800 |
| 2013 | $3,048 | $154,000 | $68,200 | $85,800 |
Map
- 23 Astral St
- 79 Bellevue Ave
- 87 Easton Ave
- 99 Potomac Rd
- 153 Falcon Ave
- 15 Christopher Rhodes Way
- 6 Christopher Rhodes Way
- 49 Recess Ln
- 417 Squantum Dr
- 26 Potomac Rd
- 72 W Shore Rd Unit 202
- 72 W Shore Rd Unit 104
- 55 Edison St
- 130 Pilgrim Pkwy Unit 5
- 110 Pilgrim Pkwy Unit 11
- 161 W Shore Rd Unit B4
- 145 Massasoit Dr
- 87 Frontier Rd
- 38 Rowe Ave
- 5 Thayer Place
Ask me questions while you tour the home.