34 Chickatabot Rd Quincy, MA 02169
Merrymount NeighborhoodEstimated Value: $927,000 - $972,503
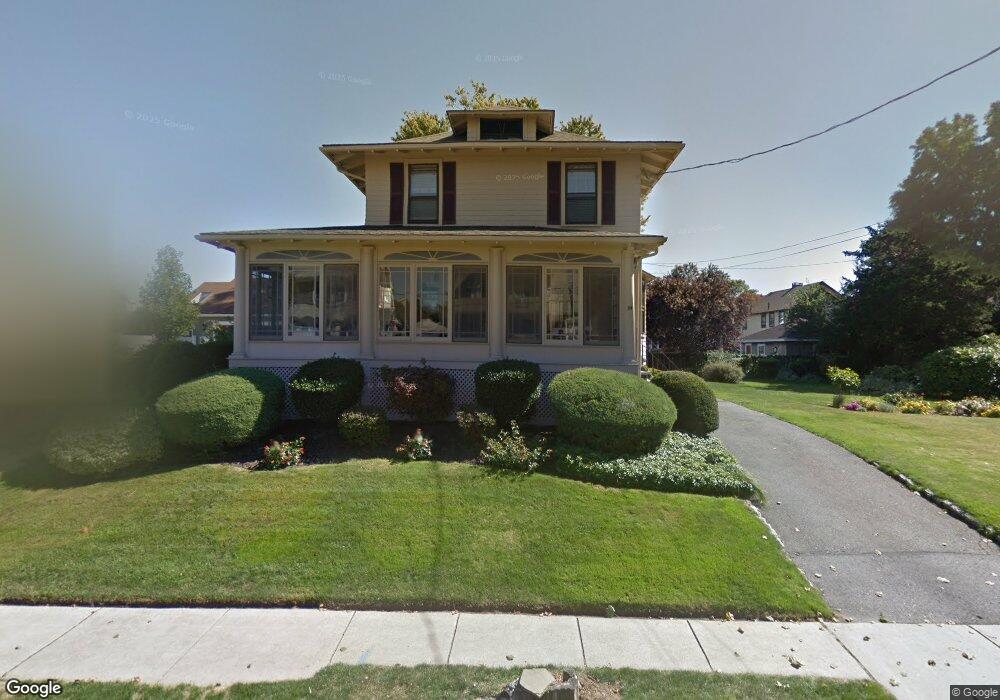
About This Home
This home is located at 34 Chickatabot Rd, Quincy, MA 02169 and is currently estimated at $949,876, approximately $404 per square foot. 34 Chickatabot Rd is a home located in Norfolk County with nearby schools including Merrymount Elementary School, Broad Meadows Middle School, and Quincy High School.
Ownership History
We collect this data history from publicly available records. To have your information removed, we recommend requesting removal directly through your county’s website.
Purchase Details
Purchase Details
Purchase Details
Home Values in the Area
Average Home Value in this Area
Purchase History
We collect this data history from publicly available records. To have your information removed, we recommend requesting removal directly through your county’s website.
| Date | Buyer | Sale Price | Title Company |
|---|---|---|---|
| -- | -- | ||
| -- | None Available | ||
| $46,900 | -- |
Mortgage History
We collect this data history from publicly available records. To have your information removed, we recommend requesting removal directly through your county’s website.
| Date | Status | Borrower | Loan Amount |
|---|---|---|---|
| Previous Owner | $195,200 | ||
| Previous Owner | $170,000 | ||
| Previous Owner | $8,213 |
Tax History
We collect this data history from publicly available records. To have your information removed, we recommend requesting removal directly through your county’s website.
| Year | Tax Paid | Tax Assessment Tax Assessment Total Assessment is a certain percentage of the fair market value that is determined by local assessors to be the total taxable value of land and additions on the property. | Land | Improvement |
|---|---|---|---|---|
| 2025 | $10,033 | $870,200 | $399,500 | $470,700 |
| 2024 | $9,573 | $849,400 | $388,100 | $461,300 |
| 2023 | $8,540 | $767,300 | $338,100 | $429,200 |
| 2022 | $8,346 | $696,700 | $282,200 | $414,500 |
| 2021 | $8,235 | $678,300 | $282,200 | $396,100 |
| 2020 | $8,116 | $652,900 | $271,500 | $381,400 |
| 2019 | $7,750 | $617,500 | $254,100 | $363,400 |
| 2018 | $7,305 | $547,600 | $211,600 | $336,000 |
| 2017 | $7,455 | $526,100 | $221,600 | $304,500 |
| 2016 | $7,173 | $499,500 | $217,500 | $282,000 |
| 2015 | $6,776 | $464,100 | $205,500 | $258,600 |
| 2014 | $6,485 | $436,400 | $199,500 | $236,900 |
Map
- 44 Chickatabot Rd
- 65 Narragansett Rd
- 245 Sea St Unit 31
- 81 Assabet Rd
- 330 Sea St
- 334 Sea St
- 338 Sea St
- 1343 Quincy Shore Dr
- 42 Plover Rd
- 105 Sea St Unit 302
- 105 Sea St Unit 101
- 105 Sea St Unit 104
- 7 Swan Rd
- 168 Furnace Brook Pkwy
- 14 Palmer St
- 36 Palmer St
- 24 Poplar Rd
- 576 Sea St
- 111 Greenleaf St
- 599 Sea St Unit 2
- 40 Chickatabot Rd
- 30 Chickatabot Rd
- 21 Hobomack Rd
- 19 Hobomack Rd
- 15 Hobomack Rd
- 15 Hobomack Rd
- 42 Chickatabot Rd
- 35 Chickatabot Rd
- 11 Hobomack Rd
- 25 Hobomack Rd
- 31 Chickatabot Rd
- 33 Chickatabot Rd
- 25 Chickatabot Rd
- 29 Hobomack Rd
- 26 Chickatabot Rd
- 5 Norton Rd
- 39 Chickatabot Rd
- 9 Norton Rd
- 23 Chickatabot Rd
- 46 Chickatabot Rd
Ask me questions while you tour the home.