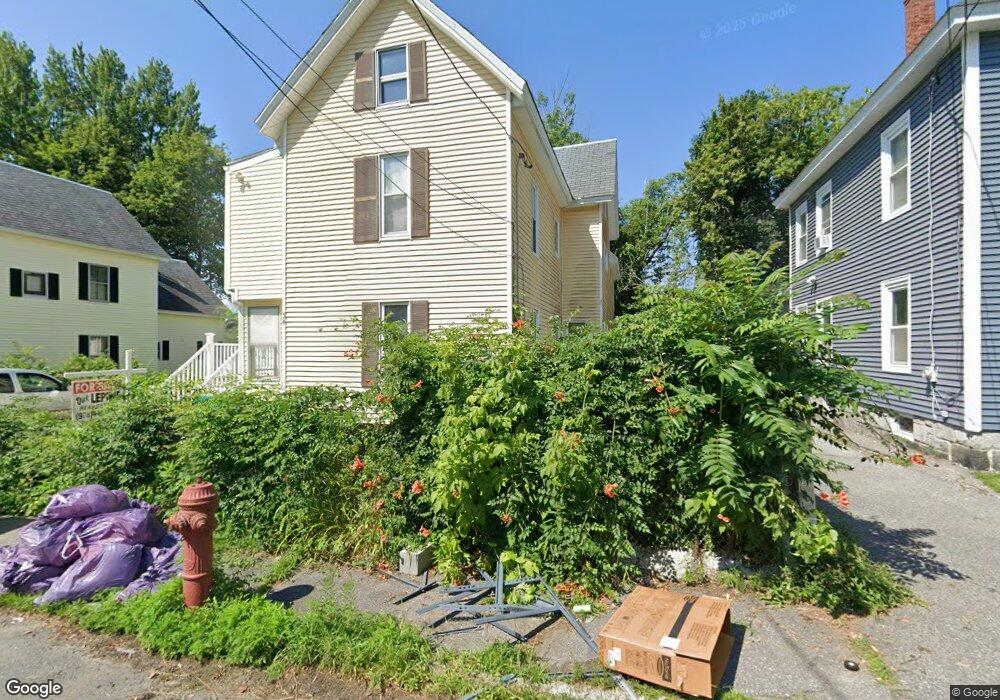
34 May St Unit 1 Lowell, MA 01850
Centralville NeighborhoodEstimated Value: $609,060 - $682,000
2
Beds
1
Bath
1,028
Sq Ft
$638/Sq Ft
Est. Value
About This Home
This home is located at 34 May St Unit 1, Lowell, MA 01850 and is currently estimated at $655,515, approximately $637 per square foot. 34 May St Unit 1 is a home located in Middlesex County with nearby schools including S. Christa McAuliffe Elementary School, Greenhalge Elementary School, and Moody Elementary School.
Ownership History
Date
Name
Owned For
Owner Type
Purchase Details
Closed on
Nov 7, 2025
Sold by
Chau Danny
Bought by
Henriquez Junior
Current Estimated Value
Home Financials for this Owner
Home Financials are based on the most recent Mortgage that was taken out on this home.
Original Mortgage
$641,250
Outstanding Balance
$639,433
Interest Rate
6.3%
Mortgage Type
New Conventional
Estimated Equity
$16,082
Purchase Details
Closed on
Jan 28, 2004
Sold by
Chau Danny and Cheung Sophia
Bought by
Chau Danny
Purchase Details
Closed on
Mar 5, 1987
Sold by
Szewelak Andrew
Bought by
Chan Danny
Home Financials for this Owner
Home Financials are based on the most recent Mortgage that was taken out on this home.
Original Mortgage
$92,800
Interest Rate
9.02%
Mortgage Type
Purchase Money Mortgage
Create a Home Valuation Report for This Property
The Home Valuation Report is an in-depth analysis detailing your home's value as well as a comparison with similar homes in the area
Home Values in the Area
Average Home Value in this Area
Purchase History
| Date | Buyer | Sale Price | Title Company |
|---|---|---|---|
| Henriquez Junior | $675,000 | -- | |
| Chau Danny | -- | -- | |
| Chau Danny | -- | -- | |
| Chau Danny | -- | -- | |
| Chan Danny | $116,000 | -- |
Source: Public Records
Mortgage History
| Date | Status | Borrower | Loan Amount |
|---|---|---|---|
| Open | Henriquez Junior | $641,250 | |
| Previous Owner | Chan Danny | $100,000 | |
| Previous Owner | Chan Danny | $89,000 | |
| Previous Owner | Chan Danny | $92,800 |
Source: Public Records
Tax History
| Year | Tax Paid | Tax Assessment Tax Assessment Total Assessment is a certain percentage of the fair market value that is determined by local assessors to be the total taxable value of land and additions on the property. | Land | Improvement |
|---|---|---|---|---|
| 2025 | $6,614 | $576,100 | $146,700 | $429,400 |
| 2024 | $6,152 | $516,500 | $137,100 | $379,400 |
| 2023 | $5,716 | $460,200 | $119,200 | $341,000 |
| 2022 | $5,288 | $416,700 | $108,400 | $308,300 |
| 2021 | $4,902 | $364,200 | $94,300 | $269,900 |
| 2020 | $4,423 | $331,100 | $82,300 | $248,800 |
| 2019 | $4,161 | $296,400 | $76,300 | $220,100 |
| 2018 | $3,881 | $269,700 | $72,700 | $197,000 |
| 2017 | $3,667 | $245,800 | $66,100 | $179,700 |
| 2016 | $3,701 | $244,100 | $64,400 | $179,700 |
| 2015 | $3,421 | $221,000 | $64,400 | $156,600 |
| 2013 | $3,113 | $207,400 | $75,400 | $132,000 |
Source: Public Records
Map
Nearby Homes
- 18 May St
- 202 Coburn St
- 35 Whitney Ave Unit 33
- 337 Beacon St
- 23 18th St
- 1 19th St Unit 3
- 45 W 4th St
- 6 Dalton St
- Lot 11 Christian St
- Lot 12 Christian St
- Lot 9 Christian St
- Lot 10 Christian St
- 25 Read St
- 105 3rd St
- 94 1st St Unit 10
- 120 Lakeview Ave
- 508 Lakeview Ave
- 43 -45 Exeter St
- 367 Hildreth St Unit 33
- 361 Hildreth St Unit 24
Your Personal Tour Guide
Ask me questions while you tour the home.