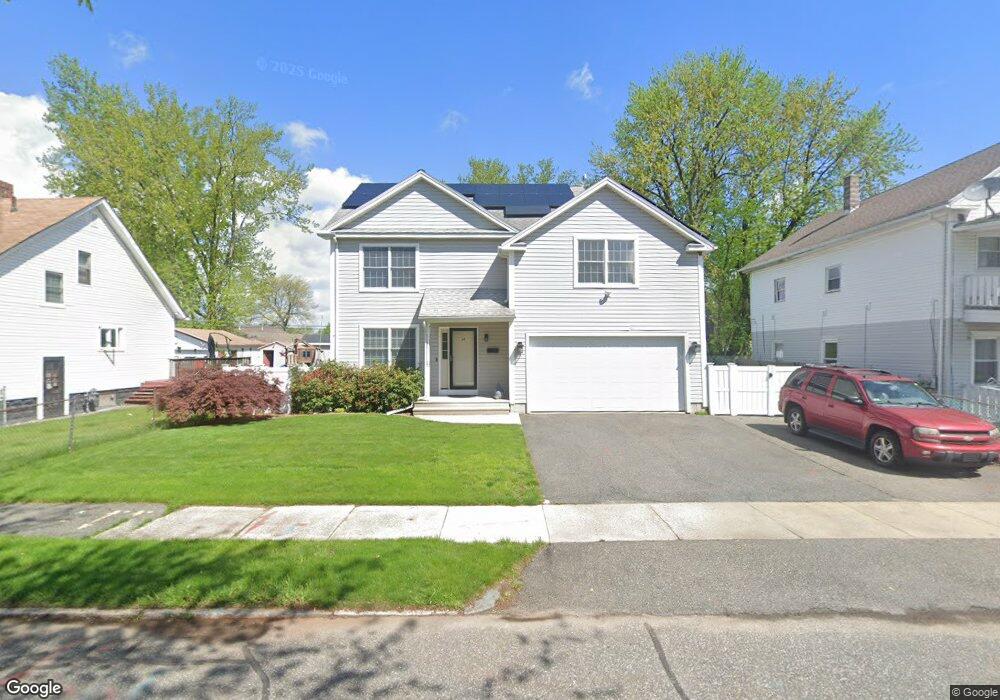
34 Moore St Springfield, MA 01107
Brightwood NeighborhoodEstimated Value: $362,000 - $465,000
4
Beds
2
Baths
2,256
Sq Ft
$187/Sq Ft
Est. Value
About This Home
This home is located at 34 Moore St, Springfield, MA 01107 and is currently estimated at $421,054, approximately $186 per square foot. 34 Moore St is a home located in Hampden County with nearby schools including High School Of Commerce, Springfield High School of Science and Technology, and Roger L. Putnam Vocational Technical Academy.
Ownership History
Date
Name
Owned For
Owner Type
Purchase Details
Closed on
May 7, 2001
Sold by
New England Farm Work
Bought by
Landrau Carlos and Landrau Madeline
Current Estimated Value
Home Financials for this Owner
Home Financials are based on the most recent Mortgage that was taken out on this home.
Original Mortgage
$120,000
Interest Rate
6.88%
Create a Home Valuation Report for This Property
The Home Valuation Report is an in-depth analysis detailing your home's value as well as a comparison with similar homes in the area
Home Values in the Area
Average Home Value in this Area
Purchase History
| Date | Buyer | Sale Price | Title Company |
|---|---|---|---|
| Landrau Carlos | $8,500 | -- |
Source: Public Records
Mortgage History
| Date | Status | Borrower | Loan Amount |
|---|---|---|---|
| Open | Landrau Carlos | $137,000 | |
| Closed | Landrau Carlos | $2,000 | |
| Closed | Landrau Carlos | $120,000 |
Source: Public Records
Tax History
| Year | Tax Paid | Tax Assessment Tax Assessment Total Assessment is a certain percentage of the fair market value that is determined by local assessors to be the total taxable value of land and additions on the property. | Land | Improvement |
|---|---|---|---|---|
| 2025 | $5,927 | $378,000 | $37,400 | $340,600 |
| 2024 | $5,300 | $330,000 | $37,400 | $292,600 |
| 2023 | $5,204 | $305,200 | $34,000 | $271,200 |
| 2022 | $5,345 | $284,000 | $31,800 | $252,200 |
| 2021 | $4,634 | $245,200 | $28,900 | $216,300 |
| 2020 | $4,177 | $213,900 | $28,900 | $185,000 |
| 2019 | $4,052 | $205,900 | $28,900 | $177,000 |
| 2018 | $3,942 | $200,300 | $28,900 | $171,400 |
| 2017 | $3,562 | $181,200 | $27,700 | $153,500 |
| 2016 | $3,346 | $170,200 | $27,700 | $142,500 |
| 2015 | $3,362 | $170,900 | $27,700 | $143,200 |
Source: Public Records
Map
Nearby Homes
- 65 Hyde Ave
- 28 Larone Ave
- 21 Merwin St
- 917 Elm St
- 50-54 Orchard St
- 224 Riverdale St
- 2 Windpath E
- 1584 Dwight St
- 62 Washburn St
- 20-22 Gay Terrace
- 31 Washburn St
- 49-53 Jefferson Ave
- 36 Shady Brook
- 334 Elm St
- 52 Osgood St
- 25 Piper Cross Rd
- 85 Narragansett St
- 58 Field St
- 57 Narragansett St
- 113 Lexington St
Your Personal Tour Guide
Ask me questions while you tour the home.