34 Moore St Springfield, MA 01107
Brightwood NeighborhoodEstimated Value: $360,000 - $437,000
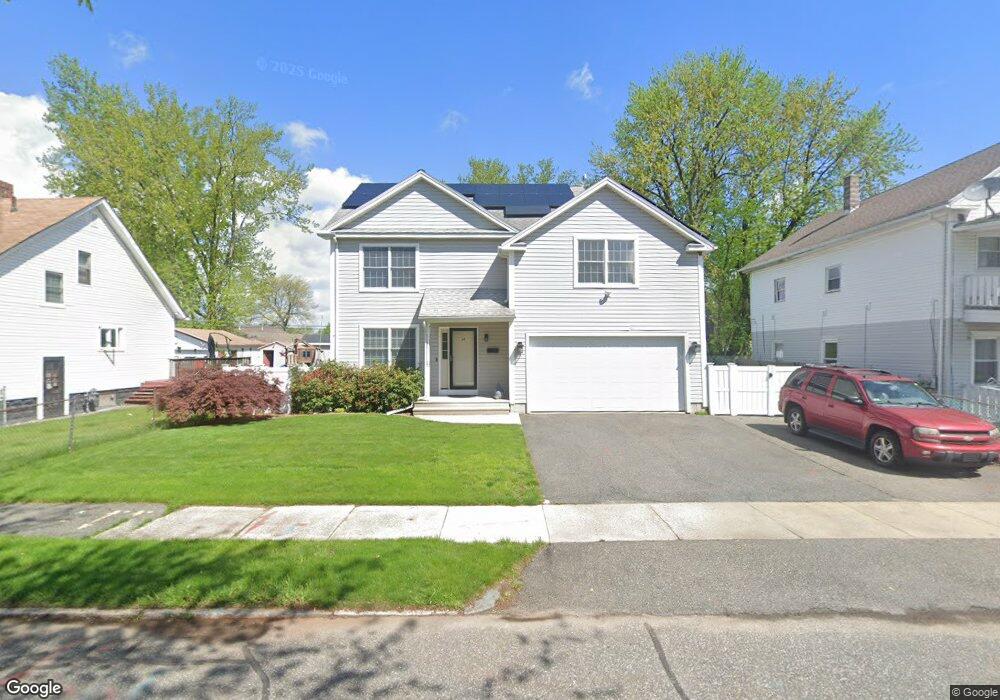
About This Home
This home is located at 34 Moore St, Springfield, MA 01107 and is currently estimated at $410,588, approximately $181 per square foot. 34 Moore St is a home located in Hampden County with nearby schools including High School Of Commerce, Springfield High School of Science and Technology, and Roger L. Putnam Vocational Technical Academy.
Ownership History
We collect this data history from publicly available records. To have your information removed, we recommend requesting removal directly through your county’s website.
Purchase Details
Home Financials for this Owner
Home Financials are based on the most recent Mortgage that was taken out on this home.Home Values in the Area
Average Home Value in this Area
Purchase History
We collect this data history from publicly available records. To have your information removed, we recommend requesting removal directly through your county’s website.
| Date | Buyer | Sale Price | Title Company |
|---|---|---|---|
| $8,500 | -- |
Mortgage History
We collect this data history from publicly available records. To have your information removed, we recommend requesting removal directly through your county’s website.
| Date | Status | Borrower | Loan Amount |
|---|---|---|---|
| Open | $36,700 | ||
| Closed | $137,000 | ||
| Closed | $135,200 | ||
| Closed | $30,000 | ||
| Closed | $127,500 | ||
| Closed | $2,000 | ||
| Closed | $120,000 |
Tax History
We collect this data history from publicly available records. To have your information removed, we recommend requesting removal directly through your county’s website.
| Year | Tax Paid | Tax Assessment Tax Assessment Total Assessment is a certain percentage of the fair market value that is determined by local assessors to be the total taxable value of land and additions on the property. | Land | Improvement |
|---|---|---|---|---|
| 2025 | $5,927 | $378,000 | $37,400 | $340,600 |
| 2024 | $5,300 | $330,000 | $37,400 | $292,600 |
| 2023 | $5,204 | $305,200 | $34,000 | $271,200 |
| 2022 | $5,345 | $284,000 | $31,800 | $252,200 |
| 2021 | $4,634 | $245,200 | $28,900 | $216,300 |
| 2020 | $4,177 | $213,900 | $28,900 | $185,000 |
| 2019 | $4,052 | $205,900 | $28,900 | $177,000 |
| 2018 | $3,942 | $200,300 | $28,900 | $171,400 |
| 2017 | $3,562 | $181,200 | $27,700 | $153,500 |
| 2016 | $3,346 | $170,200 | $27,700 | $142,500 |
| 2015 | $3,362 | $170,900 | $27,700 | $143,200 |
Map
- 30 Clayton St Unit F
- 1304 Elm St Unit 3C
- 732 Elm St
- 116 Derby Dingle St
- 32-34 Montmorenci St
- 36 Shady Brook
- 16 Hickory Hill
- 21 Elmwood Ave
- 46-48 Narragansett St
- 179 Knollwood St
- 116-118 Massasoit St
- 78 Marble Ave
- 177 Marion St
- 53-55 Allendale St
- 59 Lathrop St
- 26 Hebron St
- 827-831 Armory St
- 62 Field St
- 127 Melha Ave
- 75 Knollwood St
- 614 Plainfield St
- 604 Plainfield St
- 624 Plainfield St
- 6 Hyde Ave
- 605 Plainfield St
- 590 Plainfield St
- 634 Plainfield St
- 599 Plainfield St
- 601 Plainfield St Unit 603
- 575 Riverside Rd
- 12 Hyde Ave
- 24 Moore St
- 597 Plainfield St
- 28 Moore St
- 565 Riverside Rd
- 15 Hyde Ave
- 591 Plainfield St
- 555 Riverside Rd
- 20 Hyde Ave
- 545 Riverside Rd
Ask me questions while you tour the home.