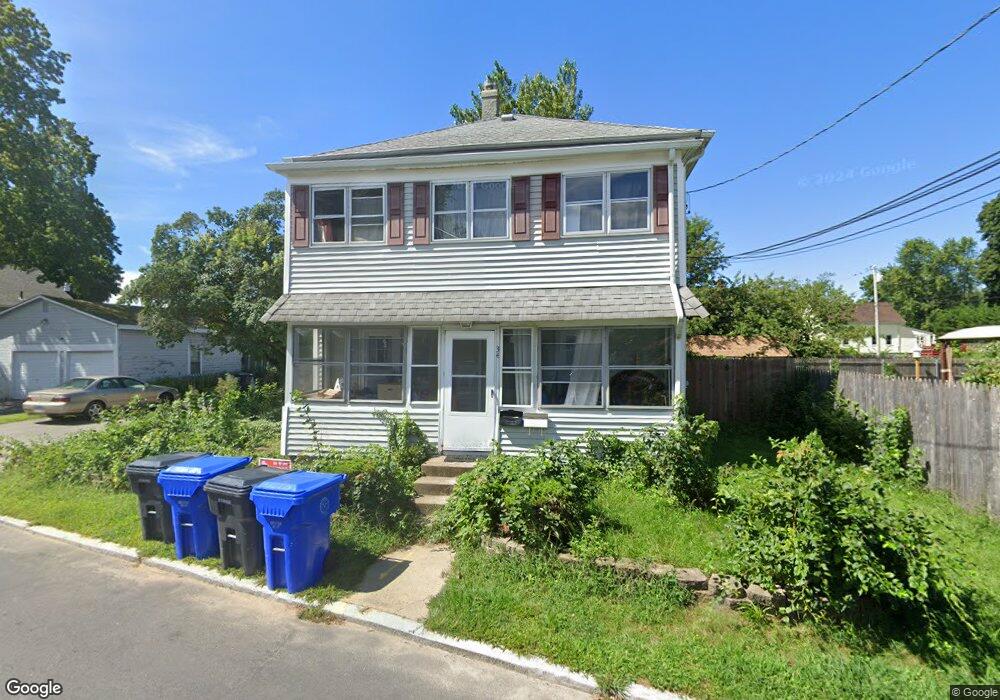
34 Read St Riverside, RI 02915
Riverside NeighborhoodEstimated Value: $466,623 - $562,000
About This Home
This home is located at 34 Read St, Riverside, RI 02915 and is currently estimated at $513,406, approximately $297 per square foot. 34 Read St is a home located in Providence County with nearby schools including East Providence High School, St Mary Academy-Bay View, and St Luke Elementary School.
Ownership History
We collect this data history from publicly available records. To have your information removed, we recommend requesting removal directly through your county’s website.
Purchase Details
Purchase Details
Purchase Details
Home Values in the Area
Average Home Value in this Area
Purchase History
We collect this data history from publicly available records. To have your information removed, we recommend requesting removal directly through your county’s website.
| Date | Buyer | Sale Price | Title Company |
|---|---|---|---|
| $174,000 | -- | ||
| $174,000 | -- | ||
| $93,500 | -- | ||
| $93,500 | -- | ||
| $114,500 | -- | ||
| $114,500 | -- |
Mortgage History
We collect this data history from publicly available records. To have your information removed, we recommend requesting removal directly through your county’s website.
| Date | Status | Borrower | Loan Amount |
|---|---|---|---|
| Closed | $133,000 | ||
| Closed | $160,000 |
Tax History
We collect this data history from publicly available records. To have your information removed, we recommend requesting removal directly through your county’s website.
| Year | Tax Paid | Tax Assessment Tax Assessment Total Assessment is a certain percentage of the fair market value that is determined by local assessors to be the total taxable value of land and additions on the property. | Land | Improvement |
|---|---|---|---|---|
| 2025 | $5,936 | $454,200 | $93,500 | $360,700 |
| 2024 | $4,904 | $319,900 | $77,900 | $242,000 |
| 2023 | $4,722 | $319,900 | $77,900 | $242,000 |
| 2022 | $4,562 | $208,700 | $46,300 | $162,400 |
| 2021 | $4,487 | $208,700 | $46,300 | $162,400 |
| 2020 | $4,297 | $208,700 | $46,300 | $162,400 |
| 2019 | $4,178 | $208,700 | $46,300 | $162,400 |
| 2018 | $4,057 | $177,300 | $49,700 | $127,600 |
| 2017 | $3,966 | $177,300 | $49,700 | $127,600 |
| 2016 | $3,947 | $177,300 | $49,700 | $127,600 |
| 2015 | $4,000 | $174,300 | $48,500 | $125,800 |
| 2014 | $4,000 | $174,300 | $48,500 | $125,800 |
Map
- 525 Willett Ave
- 103 Burnside Ave
- 15 Rhodes Ave
- 49 Arnold St
- 714 Willett Ave
- 45 Smith St
- 14 North St
- 79 Sherman St
- 80 Circuit Dr
- 13 Peach Orchard Dr
- 26 Peach Orchard Dr
- 38 Padelford Ave
- 17 Padelford Ave
- 45 Forbes St
- 82 Leroy Dr
- 145 Oak Crest Dr Unit 147
- 33 Jefferson Ave
- 50 Washington Ave
- 17 Sherman St
- 40 Jackson Ave
Ask me questions while you tour the home.