34 Wade Way Hanover, MA 02339
Hanover AreaEstimated Value: $923,000 - $982,000
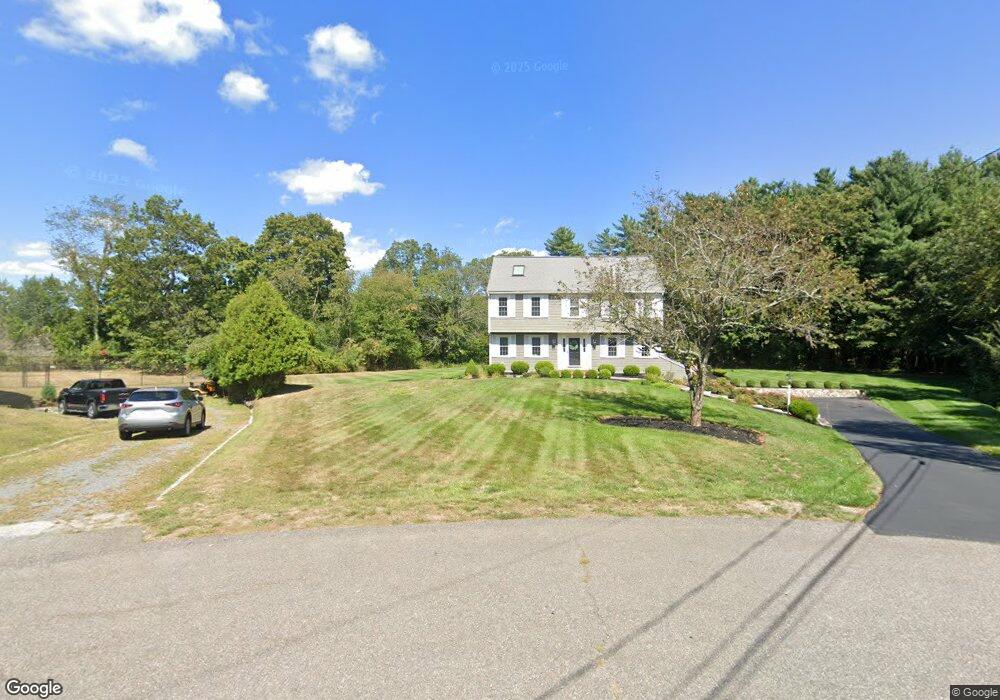
About This Home
This home is located at 34 Wade Way, Hanover, MA 02339 and is currently estimated at $940,093, approximately $451 per square foot. 34 Wade Way is a home located in Plymouth County with nearby schools including Hanover High School, South Shore Charter Public School, and Norwell KinderCare.
Ownership History
We collect this data history from publicly available records. To have your information removed, we recommend requesting removal directly through your county’s website.
Purchase Details
Purchase Details
Home Financials for this Owner
Home Financials are based on the most recent Mortgage that was taken out on this home.Purchase Details
Home Values in the Area
Average Home Value in this Area
Purchase History
We collect this data history from publicly available records. To have your information removed, we recommend requesting removal directly through your county’s website.
| Date | Buyer | Sale Price | Title Company |
|---|---|---|---|
| -- | None Available | ||
| $769,000 | None Available | ||
| $166,400 | -- |
Mortgage History
We collect this data history from publicly available records. To have your information removed, we recommend requesting removal directly through your county’s website.
| Date | Status | Borrower | Loan Amount |
|---|---|---|---|
| Previous Owner | $647,201 | ||
| Previous Owner | $404,300 | ||
| Previous Owner | $170,000 | ||
| Previous Owner | $294,000 | ||
| Previous Owner | $294,000 |
Tax History
We collect this data history from publicly available records. To have your information removed, we recommend requesting removal directly through your county’s website.
| Year | Tax Paid | Tax Assessment Tax Assessment Total Assessment is a certain percentage of the fair market value that is determined by local assessors to be the total taxable value of land and additions on the property. | Land | Improvement |
|---|---|---|---|---|
| 2025 | $9,512 | $770,200 | $280,500 | $489,700 |
| 2024 | $9,294 | $723,800 | $280,500 | $443,300 |
| 2023 | $8,706 | $645,400 | $255,200 | $390,200 |
| 2022 | $9,170 | $601,300 | $255,200 | $346,100 |
| 2021 | $9,155 | $560,600 | $232,100 | $328,500 |
| 2020 | $8,915 | $546,600 | $232,100 | $314,500 |
| 2019 | $8,996 | $527,000 | $232,100 | $294,900 |
| 2018 | $8,129 | $499,300 | $232,100 | $267,200 |
| 2017 | $7,837 | $474,400 | $215,900 | $258,500 |
| 2016 | $7,574 | $449,200 | $196,300 | $252,900 |
| 2015 | $7,255 | $449,200 | $196,300 | $252,900 |
Map
- 72 Beckford Farm Rd
- 179 High St
- 418 Webster St
- 165-B High St
- 165 High St
- 25 Buffum Rd
- 38 Juniper Ln Unit 38
- 239 Washington St Unit 18
- 978 Main St
- 214 Washington St Unit 28
- 42 Bard Rock Ln
- 5 Blueberry Ct
- 16 Holly Ct
- 9 Douglas Ave
- 7 Assinippi Ave Unit 214
- 70 Holly Berry Ln
- 198 Pond St
- 49 Dana Rd
- 136 Pond St
- 120 Deerfield Ln
Ask me questions while you tour the home.