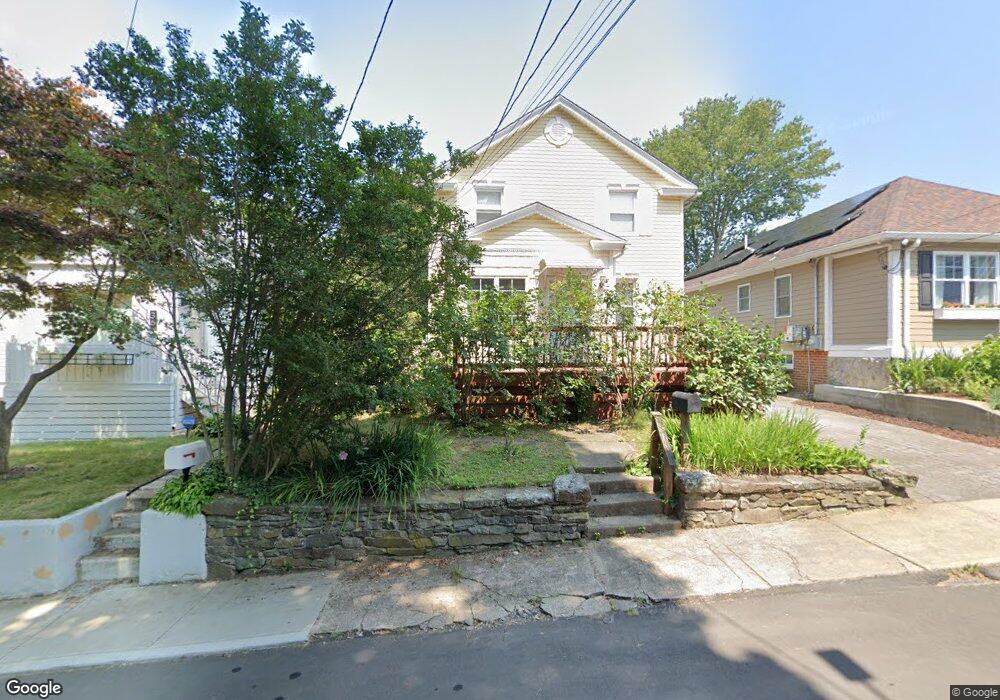
34 Wall St Milford, CT 06460
Woodmont NeighborhoodEstimated Value: $485,890 - $761,000
4
Beds
3
Baths
1,472
Sq Ft
$417/Sq Ft
Est. Value
About This Home
This home is located at 34 Wall St, Milford, CT 06460 and is currently estimated at $613,223, approximately $416 per square foot. 34 Wall St is a home located in New Haven County with nearby schools including Live Oaks School, East Shore Middle School, and Joseph A. Foran High School.
Ownership History
Date
Name
Owned For
Owner Type
Purchase Details
Closed on
Jul 23, 2007
Sold by
Carberry John
Bought by
Wilson Jordan and Wilson Esther
Current Estimated Value
Home Financials for this Owner
Home Financials are based on the most recent Mortgage that was taken out on this home.
Original Mortgage
$275,200
Interest Rate
6.54%
Purchase Details
Closed on
Nov 6, 2002
Sold by
Toyloy Karl B and Toyloy Roberta L
Bought by
Carberry John
Create a Home Valuation Report for This Property
The Home Valuation Report is an in-depth analysis detailing your home's value as well as a comparison with similar homes in the area
Home Values in the Area
Average Home Value in this Area
Purchase History
| Date | Buyer | Sale Price | Title Company |
|---|---|---|---|
| Wilson Jordan | $344,000 | -- | |
| Wilson Jordan | $344,000 | -- | |
| Carberry John | $191,000 | -- | |
| Carberry John | $191,000 | -- |
Source: Public Records
Mortgage History
| Date | Status | Borrower | Loan Amount |
|---|---|---|---|
| Open | Carberry John | $266,670 | |
| Closed | Carberry John | $275,200 |
Source: Public Records
Tax History
| Year | Tax Paid | Tax Assessment Tax Assessment Total Assessment is a certain percentage of the fair market value that is determined by local assessors to be the total taxable value of land and additions on the property. | Land | Improvement |
|---|---|---|---|---|
| 2025 | $7,288 | $246,620 | $99,100 | $147,520 |
| 2024 | $7,187 | $246,620 | $99,100 | $147,520 |
| 2023 | $6,701 | $246,620 | $99,100 | $147,520 |
| 2022 | $6,529 | $245,000 | $99,100 | $145,900 |
| 2021 | $5,709 | $206,480 | $75,460 | $131,020 |
| 2020 | $5,715 | $206,480 | $75,460 | $131,020 |
| 2019 | $5,722 | $206,480 | $75,460 | $131,020 |
| 2018 | $5,728 | $206,480 | $75,460 | $131,020 |
| 2017 | $5,738 | $206,480 | $75,460 | $131,020 |
| 2016 | $4,728 | $169,820 | $48,510 | $121,310 |
| 2015 | $4,735 | $169,820 | $48,510 | $121,310 |
| 2014 | $4,623 | $169,820 | $48,510 | $121,310 |
Source: Public Records
Map
Nearby Homes
- 6 Howe St
- 29 Anderson Ave
- 46 Salem Walk
- 24 Anderson Ave
- 12 Usher St
- 216 Anderson Ave
- 330 Merwin Ave Unit 1D
- 106 Hawley Ave
- 32 1/2 Village Rd
- 22 Lynmoor St
- 217 Merwin Ave
- 36 Kenwood Rd
- 15 Brewster Rd
- 16 Brewster Rd
- 21 Susquehanna Ave
- 14 Annawon Ave
- 83 Pauline Ave
- 76 Sandpiper Crescent
- 29 Meetinghouse Ln
- 77 Merwin Ave Unit A
Your Personal Tour Guide
Ask me questions while you tour the home.