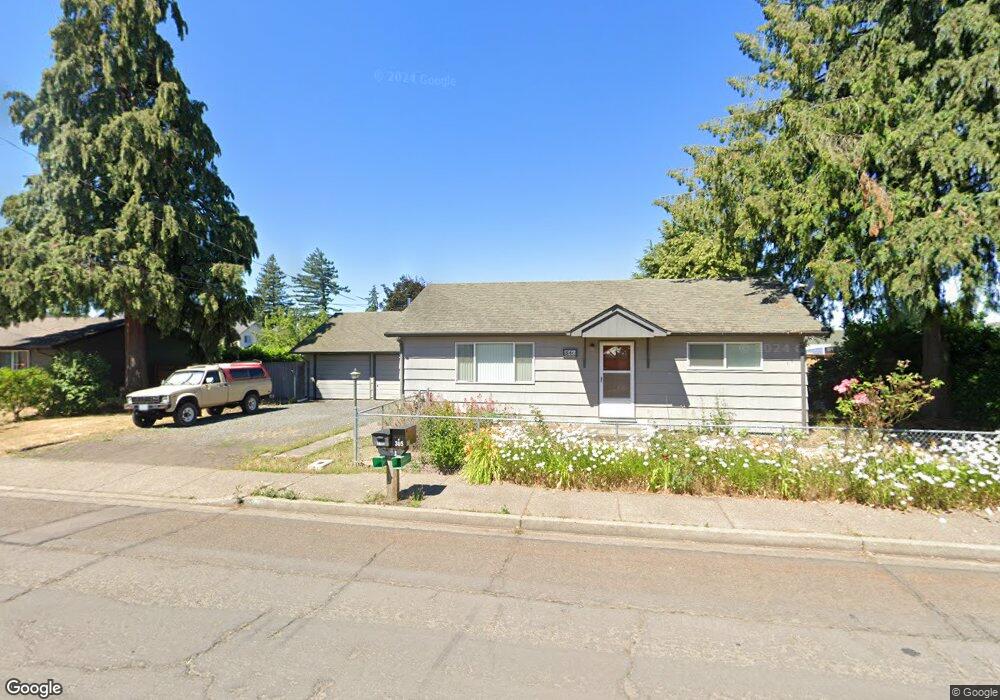
340 36th St Springfield, OR 97478
East Springfield NeighborhoodEstimated Value: $328,000 - $362,417
3
Beds
2
Baths
1,176
Sq Ft
$290/Sq Ft
Est. Value
About This Home
This home is located at 340 36th St, Springfield, OR 97478 and is currently estimated at $340,604, approximately $289 per square foot. 340 36th St is a home located in Lane County with nearby schools including Riverbend Elementary School, Briggs Middle School, and Thurston High School.
Ownership History
Date
Name
Owned For
Owner Type
Purchase Details
Closed on
Mar 31, 2004
Sold by
Couts Wilbert C
Bought by
Shelton Tina B and Myers Glenn O
Current Estimated Value
Home Financials for this Owner
Home Financials are based on the most recent Mortgage that was taken out on this home.
Original Mortgage
$91,920
Outstanding Balance
$42,330
Interest Rate
5.57%
Mortgage Type
Purchase Money Mortgage
Estimated Equity
$298,274
Purchase Details
Closed on
Jan 15, 2004
Sold by
Couts Wilbert C and Couts Linda L
Bought by
Couts Wilbert C
Purchase Details
Closed on
Sep 21, 2000
Sold by
Ban Stella M and Bateman Stella M
Bought by
Couts Wilbert C and Couts Linda L
Home Financials for this Owner
Home Financials are based on the most recent Mortgage that was taken out on this home.
Original Mortgage
$99,847
Interest Rate
8.07%
Mortgage Type
FHA
Create a Home Valuation Report for This Property
The Home Valuation Report is an in-depth analysis detailing your home's value as well as a comparison with similar homes in the area
Home Values in the Area
Average Home Value in this Area
Purchase History
We collect this data history from publicly available records. To have your information removed, we recommend requesting removal directly through your county’s website.
| Date | Buyer | Sale Price | Title Company |
|---|---|---|---|
| Shelton Tina B | $114,900 | Western Pioneer Title Co | |
| Couts Wilbert C | $1,810 | Western Pioneer Title Co | |
| Couts Wilbert C | $100,000 | Western Title & Escrow Compa |
Source: Public Records
Mortgage History
We collect this data history from publicly available records. To have your information removed, we recommend requesting removal directly through your county’s website.
| Date | Status | Borrower | Loan Amount |
|---|---|---|---|
| Open | Shelton Tina B | $91,920 | |
| Previous Owner | Couts Wilbert C | $99,847 | |
| Closed | Shelton Tina B | $22,980 |
Source: Public Records
Tax History
| Year | Tax Paid | Tax Assessment Tax Assessment Total Assessment is a certain percentage of the fair market value that is determined by local assessors to be the total taxable value of land and additions on the property. | Land | Improvement |
|---|---|---|---|---|
| 2025 | $2,543 | $138,679 | -- | -- |
| 2024 | $2,502 | $134,640 | -- | -- |
| 2023 | $2,502 | $130,719 | $0 | $0 |
| 2022 | $2,317 | $126,912 | $0 | $0 |
| 2021 | $2,276 | $123,216 | $0 | $0 |
| 2020 | $2,209 | $119,628 | $0 | $0 |
| 2019 | $2,143 | $116,144 | $0 | $0 |
| 2018 | $2,020 | $109,478 | $0 | $0 |
| 2017 | $1,942 | $109,478 | $0 | $0 |
| 2016 | $1,901 | $106,289 | $0 | $0 |
| 2015 | $1,847 | $103,193 | $0 | $0 |
| 2014 | $1,819 | $100,187 | $0 | $0 |
Source: Public Records
Map
Nearby Homes
Your Personal Tour Guide
Ask me questions while you tour the home.