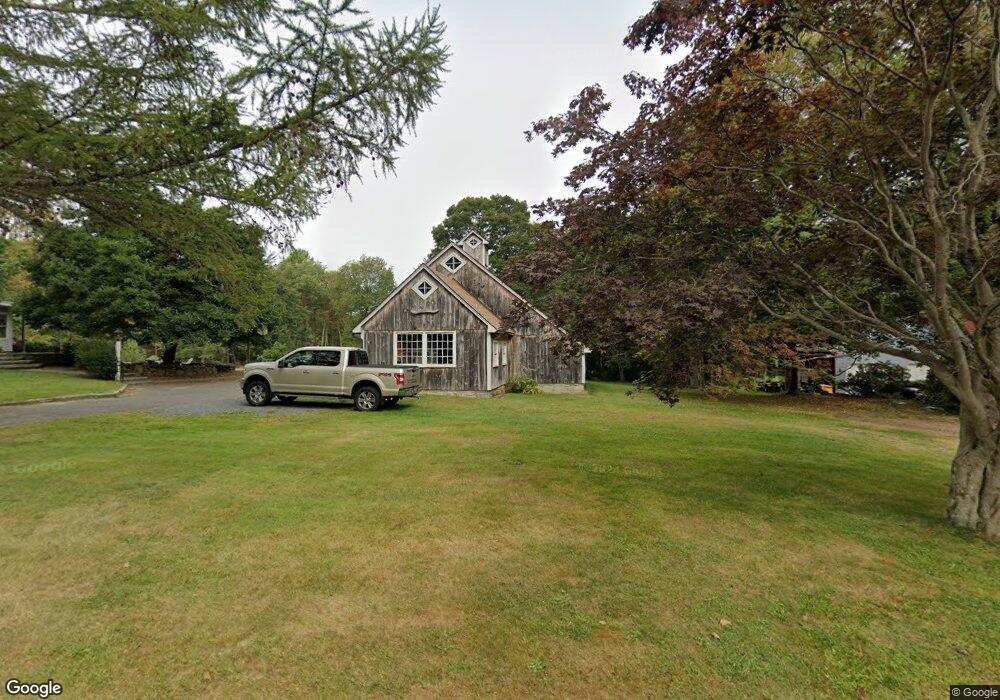
340 Hubbard Rd Higganum, CT 06441
Estimated Value: $473,000 - $636,000
3
Beds
2
Baths
2,356
Sq Ft
$248/Sq Ft
Est. Value
About This Home
This home is located at 340 Hubbard Rd, Higganum, CT 06441 and is currently estimated at $584,109, approximately $247 per square foot. 340 Hubbard Rd is a home located in Middlesex County with nearby schools including Haddam-Killingworth High School.
Ownership History
Date
Name
Owned For
Owner Type
Purchase Details
Closed on
Dec 17, 2018
Sold by
Albert Steve A
Bought by
Albert Steve A and Albert Michelle R
Current Estimated Value
Purchase Details
Closed on
Oct 26, 2011
Sold by
Bacon John T and Bacon Adelaide B
Bought by
Albert Steve A
Home Financials for this Owner
Home Financials are based on the most recent Mortgage that was taken out on this home.
Original Mortgage
$411,153
Interest Rate
4.11%
Create a Home Valuation Report for This Property
The Home Valuation Report is an in-depth analysis detailing your home's value as well as a comparison with similar homes in the area
Home Values in the Area
Average Home Value in this Area
Purchase History
We collect this data history from publicly available records. To have your information removed, we recommend requesting removal directly through your county’s website.
| Date | Buyer | Sale Price | Title Company |
|---|---|---|---|
| Albert Steve A | -- | -- | |
| Albert Steve A | $402,500 | -- |
Source: Public Records
Mortgage History
We collect this data history from publicly available records. To have your information removed, we recommend requesting removal directly through your county’s website.
| Date | Status | Borrower | Loan Amount |
|---|---|---|---|
| Previous Owner | Albert Steve A | $411,153 | |
| Previous Owner | Albert Steve A | $250,000 | |
| Previous Owner | Albert Steve A | $340,000 | |
| Previous Owner | Albert Steve A | $250,000 |
Source: Public Records
Tax History
| Year | Tax Paid | Tax Assessment Tax Assessment Total Assessment is a certain percentage of the fair market value that is determined by local assessors to be the total taxable value of land and additions on the property. | Land | Improvement |
|---|---|---|---|---|
| 2025 | $10,884 | $316,870 | $59,560 | $257,310 |
| 2024 | $10,884 | $316,870 | $59,560 | $257,310 |
| 2023 | $10,732 | $316,870 | $59,560 | $257,310 |
| 2022 | $10,244 | $316,870 | $59,560 | $257,310 |
| 2021 | $855 | $316,870 | $59,560 | $257,310 |
| 2020 | $5,424 | $258,420 | $68,630 | $189,790 |
| 2019 | $8,189 | $258,420 | $68,630 | $189,790 |
| 2018 | $8,189 | $258,420 | $68,630 | $189,790 |
| 2017 | $8,189 | $258,420 | $68,630 | $189,790 |
| 2016 | $8,063 | $258,420 | $68,630 | $189,790 |
| 2015 | $8,551 | $274,070 | $69,960 | $204,110 |
| 2014 | $8,466 | $274,070 | $69,960 | $204,110 |
Source: Public Records
Map
Nearby Homes
- 0 S Dish Mill Rd Unit 24082788
- 680 Killingworth Rd
- 57 Hubbard Rd
- 6 Morris Hubbard Rd
- 230 Killingworth Rd
- 81 Meeting House Rd
- 55 Burr Rd
- 882 Killingworth Rd
- 6 Chestnut Cir
- 0 Swain Johnson Trail Unit 2
- 0 Saybrook Rd
- 37 Arkona Dr
- 25 Silver Springs Dr
- 59 Hidden Lake Rd
- 29 Spencer Rd
- 33 Case Cir
- 1143 & 1145 Saybrook Rd
- 1145 Saybrook Rd
- 1143 Saybrook Rd
- 195A Injun Hollow Rd
- 332 Hubbard Rd
- 0 Morris Rd Unit 24023903
- 0 Morris Rd Unit 170522165
- 335 Hubbard Rd
- 9 Morris Rd
- 352 Hubbard Rd
- 321 Hubbard Rd
- 24 Morris Rd
- 345 Hubbard Rd
- 11 Morris Rd
- 28 Morris Rd
- 360 Hubbard Rd
- 320 Hubbard Rd
- 31 Morris Rd
- 9 Ponsett Rd
- 32 Morris Rd
- 10 Ponsett Rd
- 364 Hubbard Rd
- 365 Hubbard Rd
- 312 Hubbard Rd
Your Personal Tour Guide
Ask me questions while you tour the home.