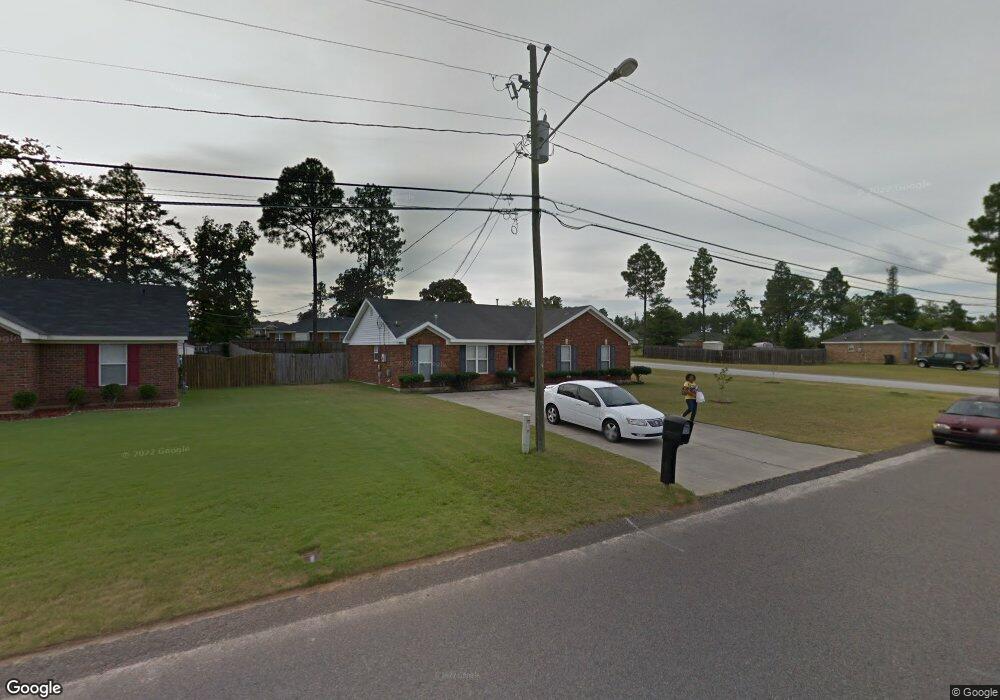
3408 Monte Carlo Dr Augusta, GA 30906
Pepperidge NeighborhoodEstimated Value: $142,000 - $219,000
3
Beds
2
Baths
1,426
Sq Ft
$132/Sq Ft
Est. Value
About This Home
This home is located at 3408 Monte Carlo Dr, Augusta, GA 30906 and is currently estimated at $188,351, approximately $132 per square foot. 3408 Monte Carlo Dr is a home located in Richmond County with nearby schools including Tobacco Road Elementary School, Richmond Hill K-8, and Johnson Magnet.
Ownership History
Date
Name
Owned For
Owner Type
Purchase Details
Closed on
May 2, 2007
Sold by
Samuels Derrick L
Bought by
Isom Wanda Jeans
Current Estimated Value
Home Financials for this Owner
Home Financials are based on the most recent Mortgage that was taken out on this home.
Original Mortgage
$114,250
Outstanding Balance
$67,857
Interest Rate
6.1%
Mortgage Type
Purchase Money Mortgage
Estimated Equity
$120,494
Purchase Details
Closed on
Aug 17, 1999
Sold by
Nordahl Homes Inc
Bought by
Samuels Derrick L
Home Financials for this Owner
Home Financials are based on the most recent Mortgage that was taken out on this home.
Original Mortgage
$88,638
Interest Rate
7.58%
Mortgage Type
VA
Purchase Details
Closed on
Oct 13, 1998
Sold by
Nordahl & Company Inc
Bought by
Nordahl & Company Inc
Purchase Details
Closed on
Sep 18, 1998
Sold by
Nordahl & Company Inc
Bought by
Nordahl Homes Inc
Purchase Details
Closed on
Aug 31, 1993
Sold by
Nordahl & Company Inc
Bought by
Nordahl & Company Inc
Create a Home Valuation Report for This Property
The Home Valuation Report is an in-depth analysis detailing your home's value as well as a comparison with similar homes in the area
Home Values in the Area
Average Home Value in this Area
Purchase History
| Date | Buyer | Sale Price | Title Company |
|---|---|---|---|
| Isom Wanda Jeans | $114,300 | None Available | |
| Samuels Derrick L | $86,900 | -- | |
| Nordahl & Company Inc | -- | -- | |
| Nordahl Homes Inc | -- | -- | |
| Nordahl & Company Inc | -- | -- |
Source: Public Records
Mortgage History
| Date | Status | Borrower | Loan Amount |
|---|---|---|---|
| Open | Isom Wanda Jeans | $114,250 | |
| Previous Owner | Samuels Derrick L | $88,638 |
Source: Public Records
Tax History
| Year | Tax Paid | Tax Assessment Tax Assessment Total Assessment is a certain percentage of the fair market value that is determined by local assessors to be the total taxable value of land and additions on the property. | Land | Improvement |
|---|---|---|---|---|
| 2025 | $2,165 | $68,092 | $7,380 | $60,712 |
| 2024 | $2,165 | $69,928 | $7,380 | $62,548 |
| 2023 | $1,223 | $65,348 | $7,380 | $57,968 |
| 2022 | $1,712 | $52,009 | $7,380 | $44,629 |
| 2021 | $1,366 | $36,589 | $7,380 | $29,209 |
| 2020 | $1,348 | $36,589 | $7,380 | $29,209 |
| 2019 | $1,418 | $36,589 | $7,380 | $29,209 |
| 2018 | $1,426 | $36,589 | $7,380 | $29,209 |
| 2017 | $1,386 | $36,589 | $7,380 | $29,209 |
| 2016 | $1,387 | $36,589 | $7,380 | $29,209 |
| 2015 | $1,396 | $36,589 | $7,380 | $29,209 |
| 2014 | $1,398 | $36,589 | $7,380 | $29,209 |
Source: Public Records
Map
Nearby Homes
- 3388 Thames Place
- 3758 Bansbury Place
- 3434 Thames Place
- 4349 White Pines Ct
- 3545 Monte Carlo Dr
- 3706 Cardiff St
- 2217 Glynn Arven Ct
- 3525 Stoney Brook Rd
- 2120 Faircrest Ave
- 2109 Oakleaf Way
- 3611 Kentwood Dr Unit 1
- 4134 Daisy Ln
- 2115 Ashley Dr
- 2152 Rosier Rd
- 2101 Rosier Rd
- 2165 Rosier Rd
- 2237 Archer Ln
- 2223 Archer Ln
- 2215 Archer Ln
- 2233 Archer Ln
- 3406 Monte Carlo Dr
- 3602 Stanton Ct
- 3410 Monte Carlo Dr
- 3404 Monte Carlo Dr
- 3604 Stanton Ct
- 3407 Monte Carlo Dr
- 3606 Stanton Ct
- 3405 Monte Carlo Dr
- 3402 Monte Carlo Dr
- 3412 Monte Carlo Dr
- 3409 Monte Carlo Dr
- 3608 Stanton Ct
- 3596 Stanton Ct
- 3598 Stanton Ct
- 3523 Brockdale Dr
- 3416 Danvers Ave
- 3610 Stanton Ct
- 3411 Monte Carlo Dr
- 3400 Monte Carlo Dr
- 3414 Monte Carlo Dr
Your Personal Tour Guide
Ask me questions while you tour the home.