Estimated Value: $471,000 - $514,000
3
Beds
2
Baths
1,224
Sq Ft
$402/Sq Ft
Est. Value
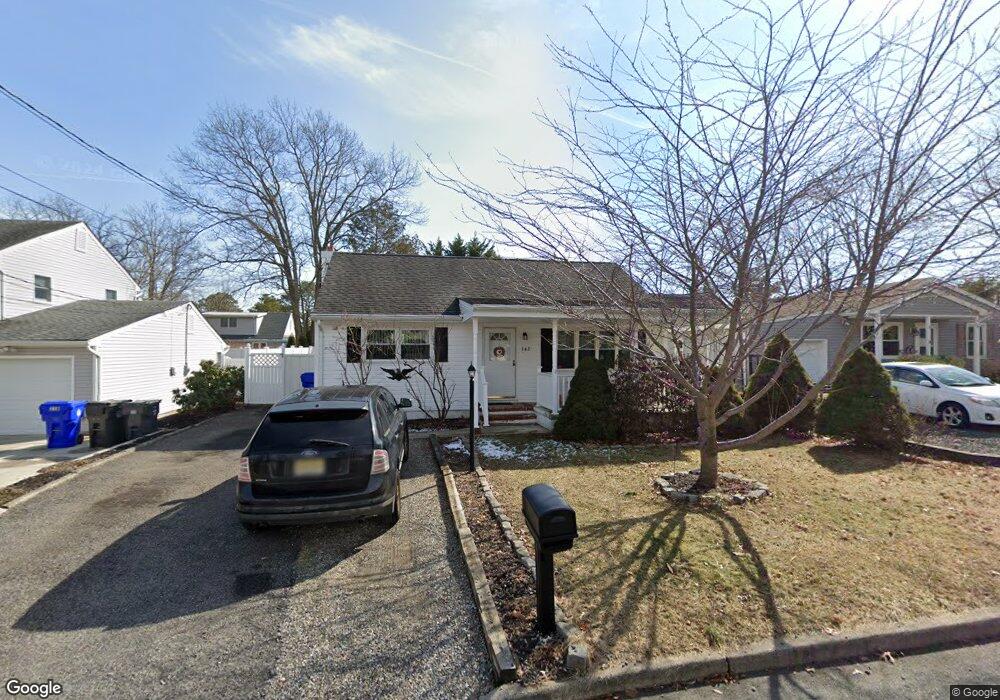
About This Home
This home is located at 342 17th Ave, Brick, NJ 08724 and is currently estimated at $491,742, approximately $401 per square foot. 342 17th Ave is a home located in Ocean County with nearby schools including Veterans Memorial Elementary School, Veterans Memorial Middle School, and Brick Township Memorial High School.
Ownership History
Date
Name
Owned For
Owner Type
Purchase Details
Closed on
Nov 4, 1998
Sold by
Kearns Geraldine M
Bought by
Schaad Patrick and Schaad Catherine
Current Estimated Value
Home Financials for this Owner
Home Financials are based on the most recent Mortgage that was taken out on this home.
Original Mortgage
$113,139
Interest Rate
6.78%
Mortgage Type
FHA
Purchase Details
Closed on
Jan 22, 1994
Sold by
Benbridge Kevin
Bought by
Kearns Geraldine M
Home Financials for this Owner
Home Financials are based on the most recent Mortgage that was taken out on this home.
Original Mortgage
$90,000
Interest Rate
7.08%
Create a Home Valuation Report for This Property
The Home Valuation Report is an in-depth analysis detailing your home's value as well as a comparison with similar homes in the area
Home Values in the Area
Average Home Value in this Area
Purchase History
| Date | Buyer | Sale Price | Title Company |
|---|---|---|---|
| Schaad Patrick | $115,000 | -- | |
| Kearns Geraldine M | $112,000 | -- |
Source: Public Records
Mortgage History
| Date | Status | Borrower | Loan Amount |
|---|---|---|---|
| Previous Owner | Schaad Patrick | $113,139 | |
| Previous Owner | Kearns Geraldine M | $90,000 |
Source: Public Records
Tax History
| Year | Tax Paid | Tax Assessment Tax Assessment Total Assessment is a certain percentage of the fair market value that is determined by local assessors to be the total taxable value of land and additions on the property. | Land | Improvement |
|---|---|---|---|---|
| 2025 | $6,463 | $235,000 | $135,000 | $100,000 |
| 2024 | $5,842 | $235,000 | $135,000 | $100,000 |
| 2023 | $5,765 | $235,000 | $135,000 | $100,000 |
| 2022 | $5,765 | $235,000 | $135,000 | $100,000 |
| 2021 | $5,646 | $235,000 | $135,000 | $100,000 |
| 2020 | $5,570 | $235,000 | $135,000 | $100,000 |
| 2019 | $5,461 | $235,000 | $135,000 | $100,000 |
| 2018 | $5,337 | $235,000 | $135,000 | $100,000 |
| 2017 | $5,194 | $235,000 | $135,000 | $100,000 |
| 2016 | $5,156 | $235,000 | $135,000 | $100,000 |
| 2015 | $5,020 | $235,000 | $135,000 | $100,000 |
| 2014 | $4,970 | $235,000 | $135,000 | $100,000 |
Source: Public Records
Map
Nearby Homes
- 370 16th Ave
- 289 16th Ave
- 295 Madison Ct
- 340 Kelly Ave
- 222 18th Ave
- 178 Calvin Ct
- 3943 Herbertsville Rd
- 432 18th Ave
- 26 Orchid Ln
- 449 Ann Ave
- 506 Azalea Dr
- 441 17th Ave
- 794 Burnt Tavern Rd
- 207 Mckinley Ct
- 506 Godfrey Lake Dr
- 726 Maple Ave
- 151 Riverside Dr N
- 524 Driscol Dr
- 170 Smith Cir
- 831 Conte Ave
Your Personal Tour Guide
Ask me questions while you tour the home.