Estimated Value: $259,000 - $293,121
About This Home
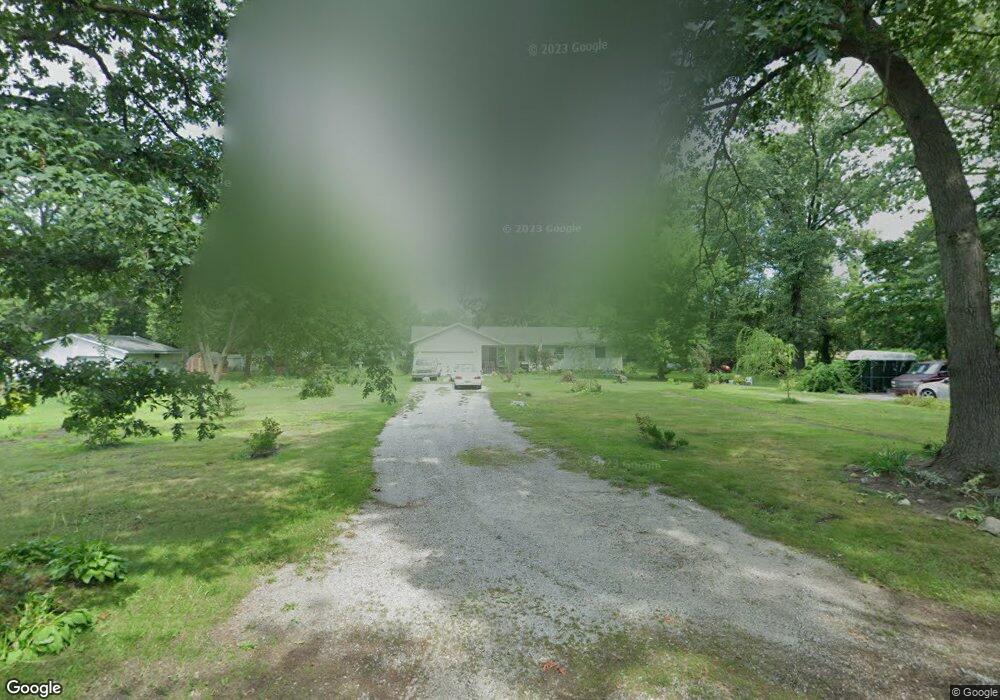
This home is located at 3440 E 200 N, Knox, IN 46534 and is currently estimated at $269,530, approximately $182 per square foot. 3440 E 200 N is a home located in Starke County with nearby schools including Knox Community Elementary School, Knox Community Middle School, and Knox Community High School.
Ownership History
We collect this data history from publicly available records. To have your information removed, we recommend requesting removal directly through your county’s website.
Purchase Details
Purchase Details
Home Financials for this Owner
Home Financials are based on the most recent Mortgage that was taken out on this home.Purchase History
We collect this data history from publicly available records. To have your information removed, we recommend requesting removal directly through your county’s website.
| Date | Buyer | Sale Price | Title Company |
|---|---|---|---|
| -- | None Listed On Document | ||
| $128,000 | Starke County Abstract Inc | ||
| -- | None Available |
Mortgage History
We collect this data history from publicly available records. To have your information removed, we recommend requesting removal directly through your county’s website.
| Date | Status | Borrower | Loan Amount |
|---|---|---|---|
| Previous Owner | $115,200 |
Tax History
We collect this data history from publicly available records. To have your information removed, we recommend requesting removal directly through your county’s website.
| Year | Tax Paid | Tax Assessment Tax Assessment Total Assessment is a certain percentage of the fair market value that is determined by local assessors to be the total taxable value of land and additions on the property. | Land | Improvement |
|---|---|---|---|---|
| 2025 | $2,848 | $228,300 | $49,000 | $179,300 |
| 2024 | $2,848 | $189,100 | $46,900 | $142,200 |
| 2023 | $2,897 | $168,600 | $39,600 | $129,000 |
| 2022 | $2,351 | $152,000 | $35,600 | $116,400 |
| 2021 | $2,246 | $130,800 | $32,800 | $98,000 |
| 2020 | $2,585 | $119,500 | $32,500 | $87,000 |
| 2019 | $2,550 | $114,500 | $31,700 | $82,800 |
| 2018 | $2,312 | $112,400 | $31,300 | $81,100 |
| 2017 | $2,187 | $109,500 | $30,900 | $78,600 |
| 2016 | $2,171 | $105,300 | $27,000 | $78,300 |
| 2014 | $1,890 | $107,500 | $27,400 | $80,100 |
| 2013 | $1,815 | $106,700 | $26,300 | $80,400 |
Map
- 1615 N 300 E
- 4500 E 300 N
- 1260 N 500 E
- 100 N Portland St
- 266 W Locust Dr
- 8305 E 25 N
- 207 W Lake St
- 2 N Pearl St
- 76 W John St
- 305 W New York St
- 154 W New York St
- 4152 S State Road 35
- 307 S East St
- 1675 U S 35
- 601 S Heaton St
- 625 S East St
- 703 S Main St
- 801 S Shield St
- 1301 W Culver Rd
- 14.89 Acres W Culver Rd
Ask me questions while you tour the home.