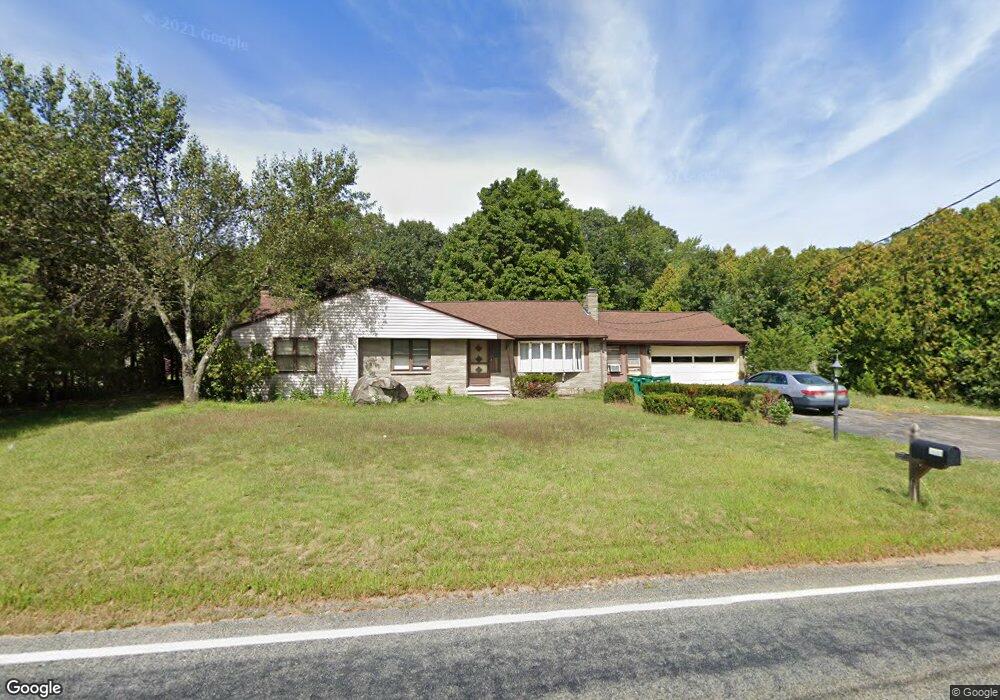
347 Balcom St Mansfield, MA 02048
Estimated Value: $626,944 - $809,000
3
Beds
2
Baths
1,638
Sq Ft
$444/Sq Ft
Est. Value
About This Home
This home is located at 347 Balcom St, Mansfield, MA 02048 and is currently estimated at $726,986, approximately $443 per square foot. 347 Balcom St is a home located in Bristol County with nearby schools including Everett W. Robinson Elementary School, Jordan/Jackson Elementary School, and Harold L. Qualters Middle School.
Ownership History
Date
Name
Owned For
Owner Type
Purchase Details
Closed on
Aug 24, 2001
Sold by
Lunn Alan T
Bought by
Grant Lawrence A
Current Estimated Value
Home Financials for this Owner
Home Financials are based on the most recent Mortgage that was taken out on this home.
Original Mortgage
$266,000
Outstanding Balance
$101,843
Interest Rate
7.21%
Mortgage Type
Purchase Money Mortgage
Estimated Equity
$625,143
Purchase Details
Closed on
Jun 16, 1987
Sold by
Scarpellini John G
Bought by
Lunn Alan T
Create a Home Valuation Report for This Property
The Home Valuation Report is an in-depth analysis detailing your home's value as well as a comparison with similar homes in the area
Home Values in the Area
Average Home Value in this Area
Purchase History
| Date | Buyer | Sale Price | Title Company |
|---|---|---|---|
| Grant Lawrence A | $280,000 | -- | |
| Grant Lawrence A | $280,000 | -- | |
| Lunn Alan T | $179,000 | -- |
Source: Public Records
Mortgage History
| Date | Status | Borrower | Loan Amount |
|---|---|---|---|
| Open | Lunn Alan T | $10,200 | |
| Open | Lunn Alan T | $266,000 |
Source: Public Records
Tax History
| Year | Tax Paid | Tax Assessment Tax Assessment Total Assessment is a certain percentage of the fair market value that is determined by local assessors to be the total taxable value of land and additions on the property. | Land | Improvement |
|---|---|---|---|---|
| 2025 | $7,204 | $547,000 | $256,800 | $290,200 |
| 2024 | $6,683 | $495,000 | $256,800 | $238,200 |
| 2023 | $6,576 | $466,700 | $256,800 | $209,900 |
| 2022 | $6,379 | $420,500 | $238,100 | $182,400 |
| 2021 | $3,323 | $400,000 | $208,100 | $191,900 |
| 2020 | $5,909 | $384,700 | $198,300 | $186,400 |
| 2019 | $5,497 | $361,200 | $165,600 | $195,600 |
| 2018 | $5,165 | $331,700 | $158,200 | $173,500 |
| 2017 | $5,056 | $336,600 | $153,900 | $182,700 |
| 2016 | $4,987 | $323,600 | $146,400 | $177,200 |
| 2015 | $4,588 | $296,000 | $146,400 | $149,600 |
Source: Public Records
Map
Nearby Homes
Your Personal Tour Guide
Ask me questions while you tour the home.