347 Main St Middlesex, NJ 08846
Estimated Value: $355,834 - $506,000
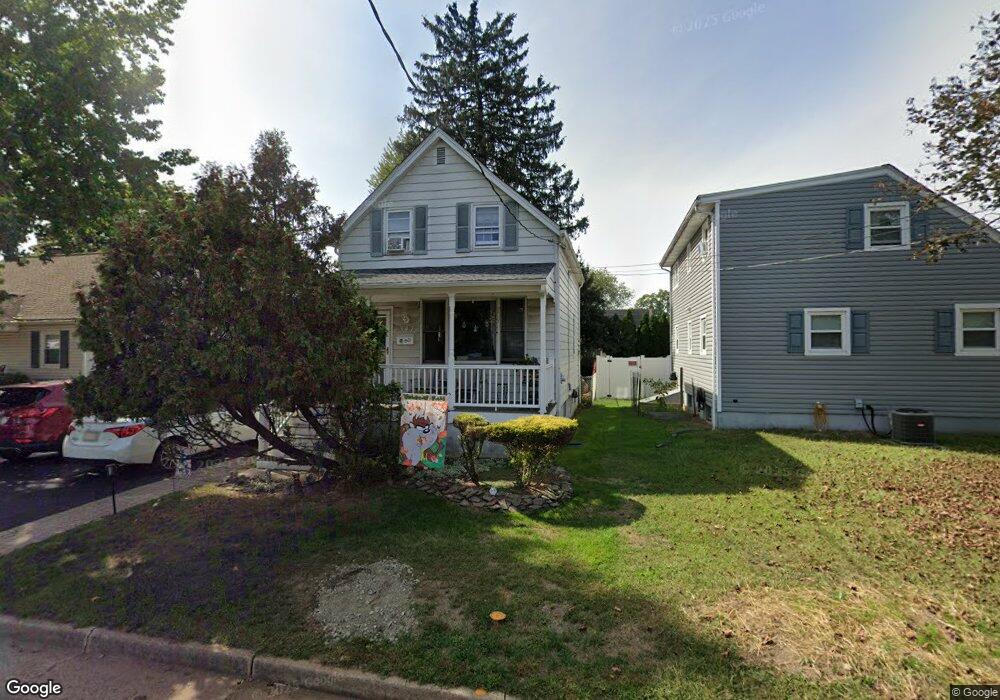
About This Home
This home is located at 347 Main St, Middlesex, NJ 08846 and is currently estimated at $404,709, approximately $576 per square foot. 347 Main St is a home located in Middlesex County with nearby schools including Middlesex High School and Our Lady of Mount Virgin School.
Ownership History
We collect this data history from publicly available records. To have your information removed, we recommend requesting removal directly through your county’s website.
Purchase Details
Home Financials for this Owner
Home Financials are based on the most recent Mortgage that was taken out on this home.Purchase Details
Home Financials for this Owner
Home Financials are based on the most recent Mortgage that was taken out on this home.Home Values in the Area
Average Home Value in this Area
Purchase History
We collect this data history from publicly available records. To have your information removed, we recommend requesting removal directly through your county’s website.
| Date | Buyer | Sale Price | Title Company |
|---|---|---|---|
| $170,000 | -- | ||
| $83,000 | -- |
Mortgage History
We collect this data history from publicly available records. To have your information removed, we recommend requesting removal directly through your county’s website.
| Date | Status | Borrower | Loan Amount |
|---|---|---|---|
| Open | $164,900 | ||
| Previous Owner | $80,000 |
Tax History
We collect this data history from publicly available records. To have your information removed, we recommend requesting removal directly through your county’s website.
| Year | Tax Paid | Tax Assessment Tax Assessment Total Assessment is a certain percentage of the fair market value that is determined by local assessors to be the total taxable value of land and additions on the property. | Land | Improvement |
|---|---|---|---|---|
| 2025 | $5,320 | $298,100 | $122,400 | $175,700 |
| 2024 | $5,065 | $229,900 | $122,400 | $107,500 |
| 2023 | $5,065 | $229,900 | $122,400 | $107,500 |
| 2022 | $5,213 | $52,700 | $25,000 | $27,700 |
| 2021 | $3,781 | $52,700 | $25,000 | $27,700 |
| 2020 | $4,965 | $52,700 | $25,000 | $27,700 |
| 2019 | $4,831 | $52,700 | $25,000 | $27,700 |
| 2018 | $4,685 | $52,700 | $25,000 | $27,700 |
| 2017 | $4,555 | $52,700 | $25,000 | $27,700 |
| 2016 | $4,405 | $52,700 | $25,000 | $27,700 |
| 2015 | $4,312 | $52,700 | $25,000 | $27,700 |
| 2014 | $4,230 | $52,700 | $25,000 | $27,700 |
Map
- 412 2nd St
- 429 1st St
- 101 Lee Dr
- 110 Parker St
- 107 Zoar Place
- 139 Lee Dr
- 215 Fairfield Ave
- 303 Stephenson Ave
- 110 Mountain Pkwy
- 126 Jay Place
- 110 Edgewood Ave
- 46 Warrenville Rd
- 55 Gramercy Gardens Place
- 142 Mountain Pkwy
- 917 Mountain Ave
- 185 Greenbrook Rd
- 31 Starlit Dr
- 118 Wilton Ave
- 643 Drake Ave
- 21 Starlit Dr
Ask me questions while you tour the home.