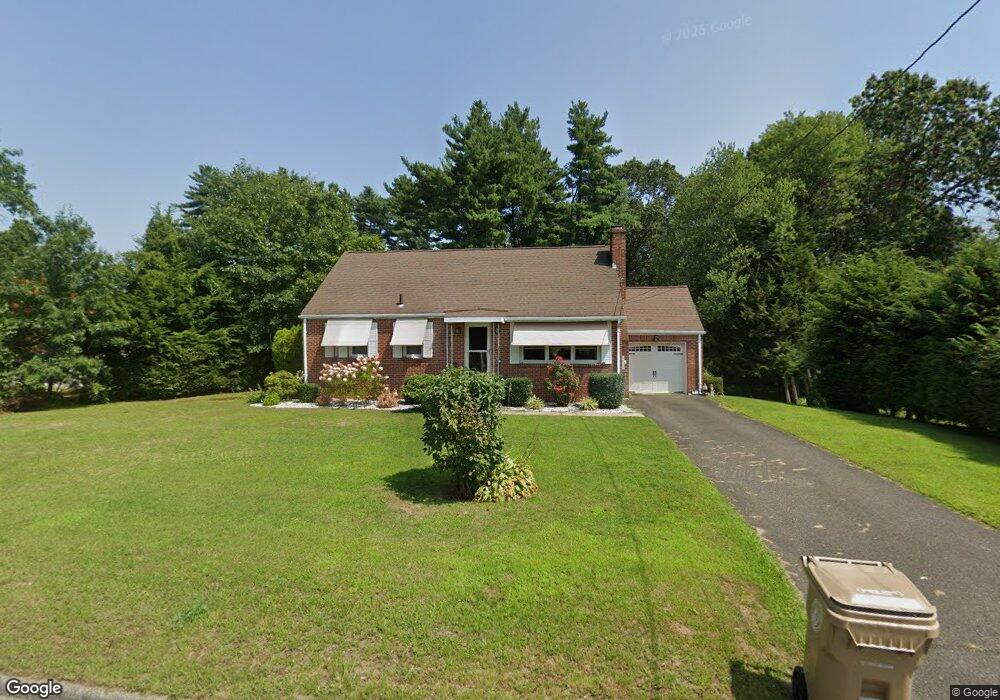
348 Chapin St Ludlow, MA 01056
Estimated Value: $305,619 - $366,000
3
Beds
1
Bath
1,203
Sq Ft
$280/Sq Ft
Est. Value
About This Home
This home is located at 348 Chapin St, Ludlow, MA 01056 and is currently estimated at $336,405, approximately $279 per square foot. 348 Chapin St is a home located in Hampden County with nearby schools including East Street Elementary School, Chapin Street Elementary School, and Paul R. Baird Middle School.
Ownership History
Date
Name
Owned For
Owner Type
Purchase Details
Closed on
Dec 5, 2014
Sold by
Panek Andrew V
Bought by
Boudreau Kelly R
Current Estimated Value
Home Financials for this Owner
Home Financials are based on the most recent Mortgage that was taken out on this home.
Original Mortgage
$126,400
Outstanding Balance
$96,455
Interest Rate
3.93%
Mortgage Type
New Conventional
Estimated Equity
$239,950
Create a Home Valuation Report for This Property
The Home Valuation Report is an in-depth analysis detailing your home's value as well as a comparison with similar homes in the area
Home Values in the Area
Average Home Value in this Area
Purchase History
| Date | Buyer | Sale Price | Title Company |
|---|---|---|---|
| Boudreau Kelly R | $163,000 | -- | |
| Boudreau Kelly R | $163,000 | -- |
Source: Public Records
Mortgage History
| Date | Status | Borrower | Loan Amount |
|---|---|---|---|
| Open | Boudreau Kelly R | $126,400 | |
| Closed | Boudreau Kelly R | $126,400 |
Source: Public Records
Tax History
| Year | Tax Paid | Tax Assessment Tax Assessment Total Assessment is a certain percentage of the fair market value that is determined by local assessors to be the total taxable value of land and additions on the property. | Land | Improvement |
|---|---|---|---|---|
| 2025 | $4,483 | $258,400 | $76,900 | $181,500 |
| 2024 | $4,349 | $240,400 | $76,700 | $163,700 |
| 2023 | $4,081 | $209,200 | $67,300 | $141,900 |
| 2022 | $3,880 | $194,100 | $67,300 | $126,800 |
| 2021 | $3,889 | $184,500 | $67,300 | $117,200 |
| 2020 | $3,726 | $180,700 | $66,300 | $114,400 |
| 2019 | $3,482 | $175,700 | $65,600 | $110,100 |
| 2018 | $3,262 | $171,600 | $65,600 | $106,000 |
| 2017 | $3,093 | $166,900 | $64,300 | $102,600 |
| 2016 | $2,937 | $162,000 | $63,100 | $98,900 |
| 2015 | $2,849 | $164,800 | $67,100 | $97,700 |
Source: Public Records
Map
Nearby Homes
- 101 Ray St
- 18 Cambridge St
- 140 Kirkland Ave
- 111 Kirkland Ave
- 39 Salli Cir
- 229 Miller St Unit F-6
- 229 Miller St Unit D-6
- 229 Miller St Unit C-1
- 31 Greenwich St
- 37 Franklin St
- 308 Miller St Unit 77
- 308 Miller St Unit 79
- 38 Prospect St
- 22 Essex St
- 70 Sroka Ln
- 142 Marion Cir
- Lot 28 Tower Rd
- 27 Lodge Ln Unit 27
- 517 Ideal Ln Unit 702
- 32 Lodge Ln Unit 32
Your Personal Tour Guide
Ask me questions while you tour the home.