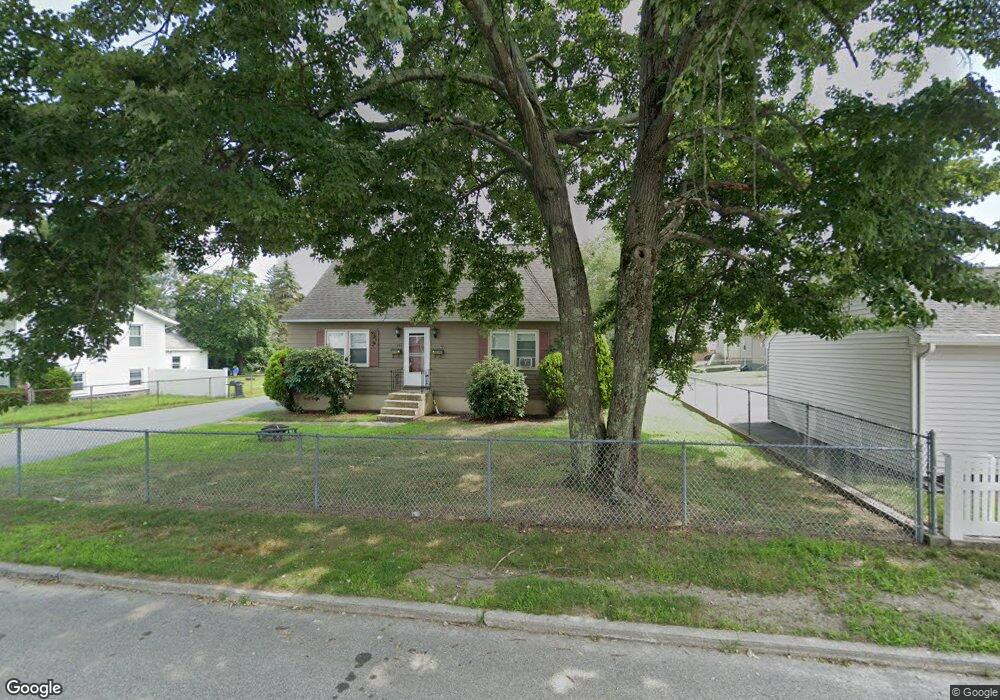
348 Orchard St Woonsocket, RI 02895
Globe District NeighborhoodEstimated Value: $423,666 - $499,000
4
Beds
2
Baths
1,941
Sq Ft
$244/Sq Ft
Est. Value
About This Home
This home is located at 348 Orchard St, Woonsocket, RI 02895 and is currently estimated at $472,917, approximately $243 per square foot. 348 Orchard St is a home located in Providence County with nearby schools including Woonsocket High School, Founders Academy, and Beacon Charter School.
Ownership History
Date
Name
Owned For
Owner Type
Purchase Details
Closed on
Mar 25, 2022
Sold by
Evans Tisha N
Bought by
Tisha Evans Ret and Evans
Current Estimated Value
Home Financials for this Owner
Home Financials are based on the most recent Mortgage that was taken out on this home.
Original Mortgage
$175,000
Outstanding Balance
$163,213
Interest Rate
3.92%
Mortgage Type
New Conventional
Estimated Equity
$309,704
Purchase Details
Closed on
Nov 3, 2008
Sold by
Fhlmc
Bought by
Evans Tisha N
Purchase Details
Closed on
Oct 10, 2008
Sold by
Martin Joseph
Bought by
Fhlmc
Purchase Details
Closed on
Sep 9, 2008
Sold by
Martin Joseph G
Bought by
Mers
Create a Home Valuation Report for This Property
The Home Valuation Report is an in-depth analysis detailing your home's value as well as a comparison with similar homes in the area
Home Values in the Area
Average Home Value in this Area
Purchase History
We collect this data history from publicly available records. To have your information removed, we recommend requesting removal directly through your county’s website.
| Date | Buyer | Sale Price | Title Company |
|---|---|---|---|
| Tisha Evans Ret | -- | None Available | |
| Tisha Evans Ret | -- | None Available | |
| Tisha Evans Ret | -- | None Available | |
| Evans Tisha N | $147,500 | -- | |
| Evans Tisha N | $147,500 | -- | |
| Fhlmc | $209,000 | -- | |
| Fhlmc | $209,000 | -- | |
| Mers | $209,000 | -- | |
| Mers | $209,000 | -- |
Source: Public Records
Mortgage History
We collect this data history from publicly available records. To have your information removed, we recommend requesting removal directly through your county’s website.
| Date | Status | Borrower | Loan Amount |
|---|---|---|---|
| Open | Tisha Evans Ret | $175,000 | |
| Closed | Tisha Evans Ret | $175,000 | |
| Previous Owner | Mers | $3,138 |
Source: Public Records
Tax History
| Year | Tax Paid | Tax Assessment Tax Assessment Total Assessment is a certain percentage of the fair market value that is determined by local assessors to be the total taxable value of land and additions on the property. | Land | Improvement |
|---|---|---|---|---|
| 2025 | $4,705 | $419,000 | $108,000 | $311,000 |
| 2024 | $4,199 | $288,800 | $95,800 | $193,000 |
| 2023 | $4,037 | $288,800 | $95,800 | $193,000 |
| 2022 | $4,037 | $288,800 | $95,800 | $193,000 |
| 2021 | $3,729 | $157,000 | $60,100 | $96,900 |
| 2020 | $3,768 | $157,000 | $60,100 | $96,900 |
| 2018 | $3,781 | $157,000 | $60,100 | $96,900 |
| 2017 | $3,919 | $130,200 | $47,000 | $83,200 |
| 2016 | $4,146 | $130,200 | $47,000 | $83,200 |
| 2015 | $4,763 | $130,200 | $47,000 | $83,200 |
| 2014 | $4,834 | $134,500 | $51,800 | $82,700 |
Source: Public Records
Map
Nearby Homes
- 182 Avenue C Unit 6
- 107 Irene Blvd
- 184 Avenue C Unit 3
- 184 Avenue C Unit 1
- 184 Avenue C Unit 2
- 184 Avenue C Unit 4
- 471 Providence St
- 43 Summit St
- 190 Coe St
- 84 Bernice Ave
- 104 Jenckes St
- 277 Ward St
- 34 Smithfield Rd
- 84 Crest Rd
- 103 Elmore Ave
- 48 Providence St
- 65 Milton Ave
- 41 Summit Ave
- 42 Transit St
- 20 New St
Your Personal Tour Guide
Ask me questions while you tour the home.