3489 Maize Rd Columbus, OH 43224
North Linden NeighborhoodEstimated Value: $237,296 - $275,000
2
Beds
1
Bath
1,776
Sq Ft
$142/Sq Ft
Est. Value
About This Home
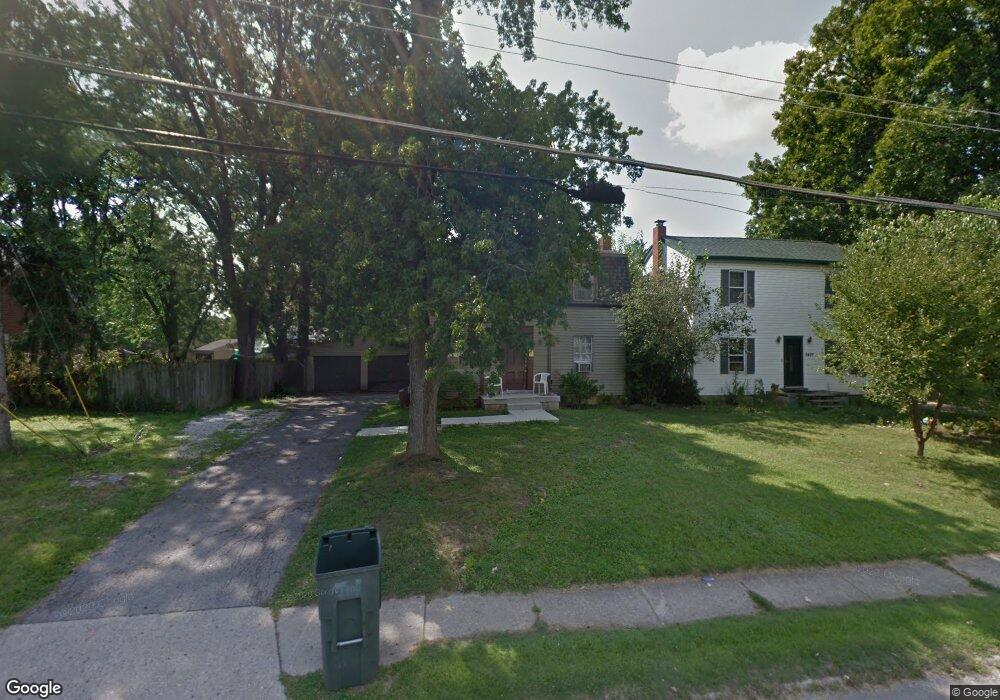
This home is located at 3489 Maize Rd, Columbus, OH 43224 and is currently estimated at $253,074, approximately $142 per square foot. 3489 Maize Rd is a home located in Franklin County with nearby schools including Maize Road Elementary School, Medina Middle School, and Mifflin High School.
Ownership History
Date
Name
Owned For
Owner Type
Purchase Details
Closed on
Mar 6, 2015
Sold by
Wolak Nicholas
Bought by
Minha Casa Llp
Current Estimated Value
Purchase Details
Closed on
Feb 2, 2015
Sold by
Johnson James and Johnson Beth
Bought by
Wolak Nicholas
Purchase Details
Closed on
May 14, 2001
Sold by
Hull William A and Hull Lois A
Bought by
Johnson James and Johnson Beth
Home Financials for this Owner
Home Financials are based on the most recent Mortgage that was taken out on this home.
Original Mortgage
$81,717
Interest Rate
7.07%
Mortgage Type
FHA
Purchase Details
Closed on
Oct 11, 1995
Sold by
Dicke Jack F
Bought by
Hull William A and Hull Lois A
Home Financials for this Owner
Home Financials are based on the most recent Mortgage that was taken out on this home.
Original Mortgage
$55,200
Interest Rate
7.75%
Mortgage Type
New Conventional
Purchase Details
Closed on
Nov 9, 1988
Create a Home Valuation Report for This Property
The Home Valuation Report is an in-depth analysis detailing your home's value as well as a comparison with similar homes in the area
Home Values in the Area
Average Home Value in this Area
Purchase History
| Date | Buyer | Sale Price | Title Company |
|---|---|---|---|
| Minha Casa Llp | -- | None Available | |
| Wolak Nicholas | $41,900 | None Available | |
| Johnson James | $83,000 | -- | |
| Hull William A | $69,000 | -- | |
| -- | $56,500 | -- |
Source: Public Records
Mortgage History
| Date | Status | Borrower | Loan Amount |
|---|---|---|---|
| Previous Owner | Johnson James | $81,717 | |
| Previous Owner | Hull William A | $55,200 |
Source: Public Records
Tax History
| Year | Tax Paid | Tax Assessment Tax Assessment Total Assessment is a certain percentage of the fair market value that is determined by local assessors to be the total taxable value of land and additions on the property. | Land | Improvement |
|---|---|---|---|---|
| 2025 | $3,241 | $43,830 | $16,910 | $26,920 |
| 2024 | $3,241 | $70,710 | $16,910 | $53,800 |
| 2023 | $3,200 | $70,700 | $16,905 | $53,795 |
| 2022 | $2,244 | $42,220 | $9,210 | $33,010 |
| 2021 | $1,961 | $36,830 | $9,210 | $27,620 |
| 2020 | $1,984 | $37,210 | $9,210 | $28,000 |
| 2019 | $1,781 | $28,640 | $7,390 | $21,250 |
| 2018 | $1,343 | $22,690 | $7,390 | $15,300 |
| 2017 | $1,411 | $22,690 | $7,390 | $15,300 |
| 2016 | $1,403 | $20,650 | $7,000 | $13,650 |
| 2015 | $1,195 | $20,650 | $7,000 | $13,650 |
| 2014 | $1,245 | $20,650 | $7,000 | $13,650 |
| 2013 | $645 | $21,700 | $7,350 | $14,350 |
Source: Public Records
Map
Nearby Homes
- 979 Urana Ave
- 3645 Maize Rd
- 3453 Eisenhower Rd
- 3546 Beulah Rd
- 1079 Acton Rd
- 1120 Piedmont Rd
- 983 Mohican Ave
- 978 E North Broadway St
- 991 Hidden Acres Ct Unit 991
- 975 Hidden Acres Ct
- 1104 E North Broadway St
- 947 Norris Dr
- 3268 McGuffey Rd
- 3147 Grasmere Ave
- 3077 Pontiac St
- 3081 Grasmere Ave
- 3930 Beulah Rd Unit 932
- 3538 Karl Rd
- 1227 E North Broadway St
- 1303 Oakland Park Ave
Your Personal Tour Guide
Ask me questions while you tour the home.