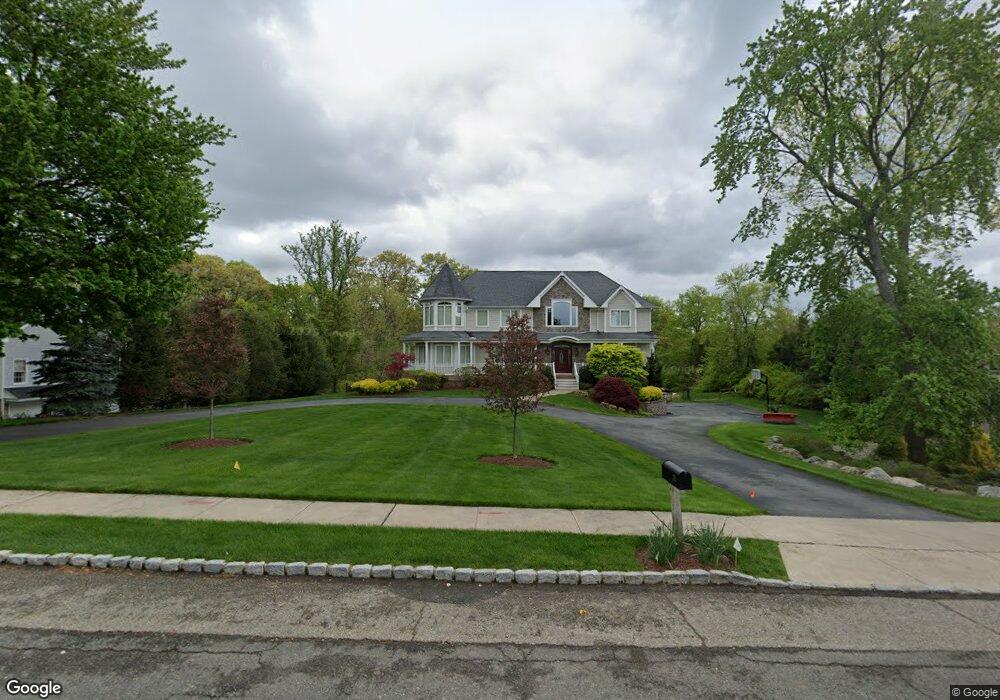
35 Abbott Rd Towaco, NJ 07082
Estimated Value: $1,395,602 - $1,601,000
Studio
--
Bath
4,028
Sq Ft
$368/Sq Ft
Est. Value
About This Home
This home is located at 35 Abbott Rd, Towaco, NJ 07082 and is currently estimated at $1,482,651, approximately $368 per square foot. 35 Abbott Rd is a home located in Morris County with nearby schools including Montville Township High School, Apple Montessori School of Towaco, and Trinity Christian School.
Ownership History
Date
Name
Owned For
Owner Type
Purchase Details
Closed on
Jan 9, 2018
Sold by
Mihlel Darlene and The Estate Of James J Conway
Bought by
Bono Joseph J
Current Estimated Value
Purchase Details
Closed on
Jul 12, 2012
Sold by
Bono Joseph J
Bought by
Bono Joseph J and Bono Pamela
Home Financials for this Owner
Home Financials are based on the most recent Mortgage that was taken out on this home.
Original Mortgage
$335,000
Interest Rate
3.7%
Mortgage Type
New Conventional
Purchase Details
Closed on
Dec 11, 2003
Sold by
Bono Cindy
Bought by
Bono Joseph
Purchase Details
Closed on
Oct 11, 1996
Sold by
Conway Muriaun and Mieiel Darlene
Bought by
Bono Joseph J
Create a Home Valuation Report for This Property
The Home Valuation Report is an in-depth analysis detailing your home's value as well as a comparison with similar homes in the area
Home Values in the Area
Average Home Value in this Area
Purchase History
| Date | Buyer | Sale Price | Title Company |
|---|---|---|---|
| Bono Joseph J | -- | None Available | |
| Bono Joseph J | -- | None Available | |
| Bono Joseph | -- | -- | |
| Bono Joseph J | $137,500 | Lawyers Title Insurance Corp |
Source: Public Records
Mortgage History
| Date | Status | Borrower | Loan Amount |
|---|---|---|---|
| Previous Owner | Bono Joseph J | $335,000 |
Source: Public Records
Tax History
| Year | Tax Paid | Tax Assessment Tax Assessment Total Assessment is a certain percentage of the fair market value that is determined by local assessors to be the total taxable value of land and additions on the property. | Land | Improvement |
|---|---|---|---|---|
| 2025 | $23,687 | $842,500 | $304,000 | $538,500 |
| 2024 | $23,187 | $892,500 | $304,000 | $588,500 |
Source: Public Records
Map
Nearby Homes
- 47 Abbott Rd
- 18 Valhalla Rd
- 4 Buck Run Ct
- 32 Virginia Rd
- 75 Washington Ct
- 18 Cable Ct Unit 48
- 18 Cable Ct
- 16 Cable Ct
- 107 Encampment Ct
- 310 Encampment Ct
- 204 Encampment Ct
- 206 Encampment Ct
- 6 Blaier St
- 20 Encampment Ct U210 Unit 210
- 20
- 201 Encampment Ct
- 29 Schneider Ln
- 20 Unit 211
- 6 Rathbun Rd
- 34 Kanouse Ln
Your Personal Tour Guide
Ask me questions while you tour the home.