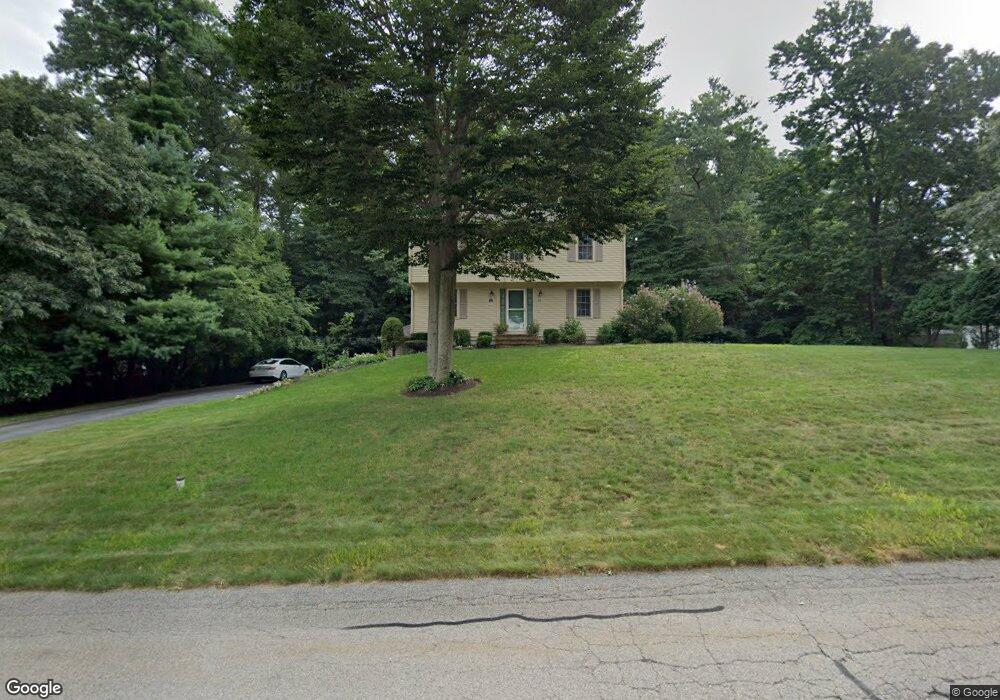
35 Captain Nathaniel Dr Hanson, MA 02341
Estimated Value: $600,000 - $705,000
3
Beds
3
Baths
1,824
Sq Ft
$356/Sq Ft
Est. Value
About This Home
This home is located at 35 Captain Nathaniel Dr, Hanson, MA 02341 and is currently estimated at $649,256, approximately $355 per square foot. 35 Captain Nathaniel Dr is a home located in Plymouth County.
Ownership History
Date
Name
Owned For
Owner Type
Purchase Details
Closed on
Oct 30, 2024
Sold by
Davis Mark C and Wheeler Patricia A
Bought by
Davis Mark C
Current Estimated Value
Purchase Details
Closed on
Jan 19, 1999
Sold by
Collamore Ests Rt and Konish William D
Bought by
Davis Mark C and Wheeler Patricia A
Home Financials for this Owner
Home Financials are based on the most recent Mortgage that was taken out on this home.
Original Mortgage
$130,000
Interest Rate
6.7%
Mortgage Type
Purchase Money Mortgage
Create a Home Valuation Report for This Property
The Home Valuation Report is an in-depth analysis detailing your home's value as well as a comparison with similar homes in the area
Home Values in the Area
Average Home Value in this Area
Purchase History
We collect this data history from publicly available records. To have your information removed, we recommend requesting removal directly through your county’s website.
| Date | Buyer | Sale Price | Title Company |
|---|---|---|---|
| Davis Mark C | -- | None Available | |
| Davis Mark C | -- | None Available | |
| Davis Mark C | $249,900 | -- | |
| Davis Mark C | $249,900 | -- |
Source: Public Records
Mortgage History
We collect this data history from publicly available records. To have your information removed, we recommend requesting removal directly through your county’s website.
| Date | Status | Borrower | Loan Amount |
|---|---|---|---|
| Previous Owner | Davis Mark C | $107,000 | |
| Previous Owner | Davis Mark C | $130,000 |
Source: Public Records
Tax History
| Year | Tax Paid | Tax Assessment Tax Assessment Total Assessment is a certain percentage of the fair market value that is determined by local assessors to be the total taxable value of land and additions on the property. | Land | Improvement |
|---|---|---|---|---|
| 2025 | $7,119 | $532,100 | $191,000 | $341,100 |
| 2024 | $6,971 | $521,000 | $185,400 | $335,600 |
| 2023 | $6,775 | $477,800 | $185,400 | $292,400 |
| 2022 | $6,612 | $438,200 | $168,600 | $269,600 |
| 2021 | $5,936 | $393,100 | $162,100 | $231,000 |
| 2020 | $5,845 | $382,800 | $156,600 | $226,200 |
| 2019 | $5,852 | $376,800 | $168,200 | $208,600 |
| 2018 | $5,778 | $365,000 | $161,700 | $203,300 |
| 2017 | $5,596 | $350,200 | $154,000 | $196,200 |
| 2016 | $5,668 | $342,500 | $154,000 | $188,500 |
| 2015 | $5,375 | $337,600 | $154,000 | $183,600 |
Source: Public Records
Map
Nearby Homes
- 724 Whitman St
- 24 Bowker Ave
- 117 E Washington St
- Lot 5 Princeton Way
- 361 County Rd
- 44 Morningside Dr
- 55 Plymouth St Unit 15
- Lot 6 Way
- Lot 2 Harvard Rd
- 700 High St
- 113 Andrew Ln
- 214 Winter St
- 43 Apollo Rd
- 12 Driftwood Ln
- 102 Ransom Rd
- 177 Pleasant St
- 126-130 Franklin St
- 241 Indian Head St
- 143 Cranberry Rd
- 26 Franklin St
- 473 Whitman St
- 40 Captain Nathaniel Dr
- 53 Captain Nathaniel Dr
- 22 Captain Nathaniel Dr
- 18 Capt Nathaniel Dr
- 8 Capt Nathaniel Dr
- 469 Whitman St
- 3 Capt Nathaniel Dr
- 118 Lexington St
- 64 Captain Nathaniel Dr
- 71 Captain Nathaniel Dr
- 470 Whitman St
- 451 Whitman St
- 464 Whitman St
- 86 Captain Nathaniel Dr
- 439 Whitman St
- 524 Whitman St
- 480 Whitman St
- 163 Captain Nathaniel Dr
- 450 Whitman St
Your Personal Tour Guide
Ask me questions while you tour the home.