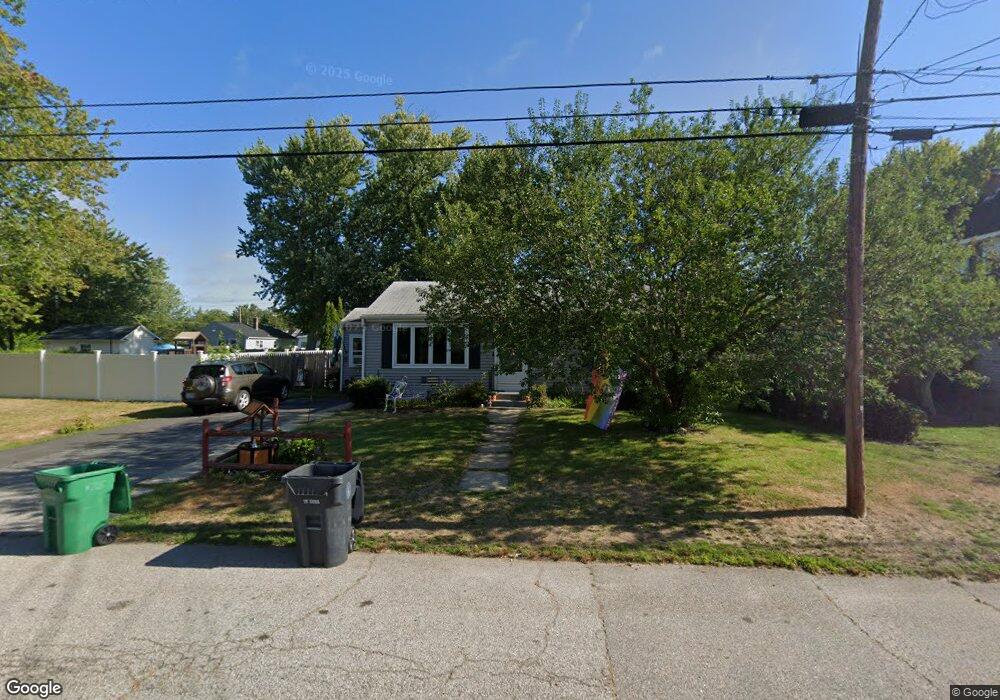
35 Chapmans Ave Warwick, RI 02886
Greenwood NeighborhoodEstimated Value: $333,000 - $365,427
About This Home
This home is located at 35 Chapmans Ave, Warwick, RI 02886 and is currently estimated at $354,607, approximately $395 per square foot. 35 Chapmans Ave is a home located in Kent County with nearby schools including St Rose Of Lima School.
Ownership History
We collect this data history from publicly available records. To have your information removed, we recommend requesting removal directly through your county’s website.
Purchase Details
Home Financials for this Owner
Home Financials are based on the most recent Mortgage that was taken out on this home.Home Values in the Area
Average Home Value in this Area
Purchase History
We collect this data history from publicly available records. To have your information removed, we recommend requesting removal directly through your county’s website.
| Date | Buyer | Sale Price | Title Company |
|---|---|---|---|
| $70,000 | -- |
Mortgage History
We collect this data history from publicly available records. To have your information removed, we recommend requesting removal directly through your county’s website.
| Date | Status | Borrower | Loan Amount |
|---|---|---|---|
| Open | $90,000 | ||
| Closed | $79,000 | ||
| Closed | $14,800 | ||
| Closed | $70,296 |
Tax History
We collect this data history from publicly available records. To have your information removed, we recommend requesting removal directly through your county’s website.
| Year | Tax Paid | Tax Assessment Tax Assessment Total Assessment is a certain percentage of the fair market value that is determined by local assessors to be the total taxable value of land and additions on the property. | Land | Improvement |
|---|---|---|---|---|
| 2025 | $4,309 | $339,300 | $134,500 | $204,800 |
| 2024 | $3,975 | $274,700 | $117,000 | $157,700 |
| 2023 | $3,864 | $272,300 | $117,000 | $155,300 |
| 2022 | $3,901 | $208,300 | $91,300 | $117,000 |
| 2021 | $3,901 | $208,300 | $91,300 | $117,000 |
| 2020 | $3,901 | $208,300 | $91,300 | $117,000 |
| 2019 | $3,901 | $208,300 | $91,300 | $117,000 |
| 2018 | $3,326 | $159,900 | $85,000 | $74,900 |
| 2017 | $3,236 | $159,900 | $85,000 | $74,900 |
| 2016 | $3,236 | $159,900 | $85,000 | $74,900 |
| 2015 | $2,847 | $137,200 | $74,900 | $62,300 |
| 2014 | $2,752 | $137,200 | $74,900 | $62,300 |
| 2013 | $2,715 | $137,200 | $74,900 | $62,300 |
Map
- 785 Main Ave
- 29 Burt St
- 40 Greenwood Ave
- 66 Scenic Dr
- 130 Vaughn Ave
- 182 Gorham Ave
- 225 Greenwood Ave
- 2907 Post Rd Unit 3
- 2907 Post Rd Unit 6
- 2907 Post Rd Unit 4
- 2907 Post Rd Unit 1
- 58 Spooner Ave
- 754 Williamsburg Cir
- 571 Pocasset Ct
- 220 Alvin St
- 875 Halifax Dr
- 1089 Greenwich Ave
- 74 Stephens Ave
- 83 Cadora Ave
- 48 Wesleyan Ave
Ask me questions while you tour the home.