Estimated Value: $533,768 - $639,000
Studio
--
Bath
1,660
Sq Ft
$358/Sq Ft
Est. Value
About This Home
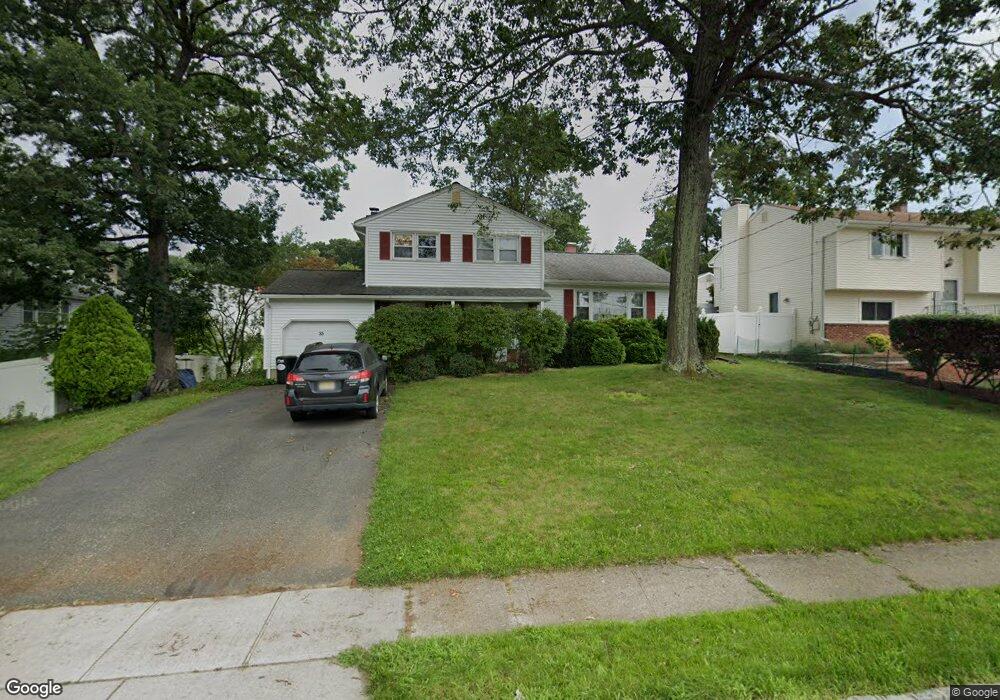
This home is located at 35 Crestmont Dr, Dover, NJ 07801 and is currently estimated at $594,692, approximately $358 per square foot. 35 Crestmont Dr is a home located in Morris County with nearby schools including Birchwood School and Copeland Middle School.
Ownership History
Date
Name
Owned For
Owner Type
Purchase Details
Closed on
Aug 19, 2005
Sold by
Lodziuk Ihor
Bought by
Collins John and Collins Lori
Current Estimated Value
Home Financials for this Owner
Home Financials are based on the most recent Mortgage that was taken out on this home.
Original Mortgage
$174,000
Outstanding Balance
$92,167
Interest Rate
5.79%
Mortgage Type
New Conventional
Estimated Equity
$502,525
Create a Home Valuation Report for This Property
The Home Valuation Report is an in-depth analysis detailing your home's value as well as a comparison with similar homes in the area
Home Values in the Area
Average Home Value in this Area
Purchase History
We collect this data history from publicly available records. To have your information removed, we recommend requesting removal directly through your county’s website.
| Date | Buyer | Sale Price | Title Company |
|---|---|---|---|
| Collins John | $435,000 | -- |
Source: Public Records
Mortgage History
We collect this data history from publicly available records. To have your information removed, we recommend requesting removal directly through your county’s website.
| Date | Status | Borrower | Loan Amount |
|---|---|---|---|
| Open | Collins John | $174,000 |
Source: Public Records
Tax History
| Year | Tax Paid | Tax Assessment Tax Assessment Total Assessment is a certain percentage of the fair market value that is determined by local assessors to be the total taxable value of land and additions on the property. | Land | Improvement |
|---|---|---|---|---|
| 2025 | $10,892 | $451,900 | $252,900 | $199,000 |
| 2024 | $10,488 | $424,800 | $228,400 | $196,400 |
| 2023 | $10,488 | $399,700 | $213,800 | $185,900 |
| 2022 | $9,924 | $371,700 | $194,400 | $177,300 |
| 2021 | $9,924 | $349,700 | $180,100 | $169,600 |
| 2020 | $9,557 | $336,400 | $170,600 | $165,800 |
| 2019 | $9,381 | $328,800 | $165,900 | $162,900 |
| 2018 | $9,178 | $316,600 | $160,400 | $156,200 |
| 2017 | $8,342 | $267,200 | $126,400 | $140,800 |
| 2016 | $8,235 | $267,200 | $126,400 | $140,800 |
| 2015 | $8,176 | $267,200 | $126,400 | $140,800 |
| 2014 | $8,024 | $267,200 | $126,400 | $140,800 |
Source: Public Records
Map
Nearby Homes
- 248 Perry St
- 208 Perry St
- 540 Herrick Dr
- 153 Birch St
- 79 Highview Terrace
- 145 Elm St
- 54 Highview Terrace
- 450 Herrick Dr
- 318 Daniel St
- 15 Blakely Ave
- 15 Sunnyhill Rd
- 90 Frogtown Rd
- 336 Mount Pleasant Ave
- 34 Hillsborough Ct Unit 34
- 25 Flintlock Terrace
- 119 Hawthorne Ct
- 10 Highland Ave
- 4 Faesch Ct
- 31 Independence Way
- 119 King St Unit 121
Your Personal Tour Guide
Ask me questions while you tour the home.