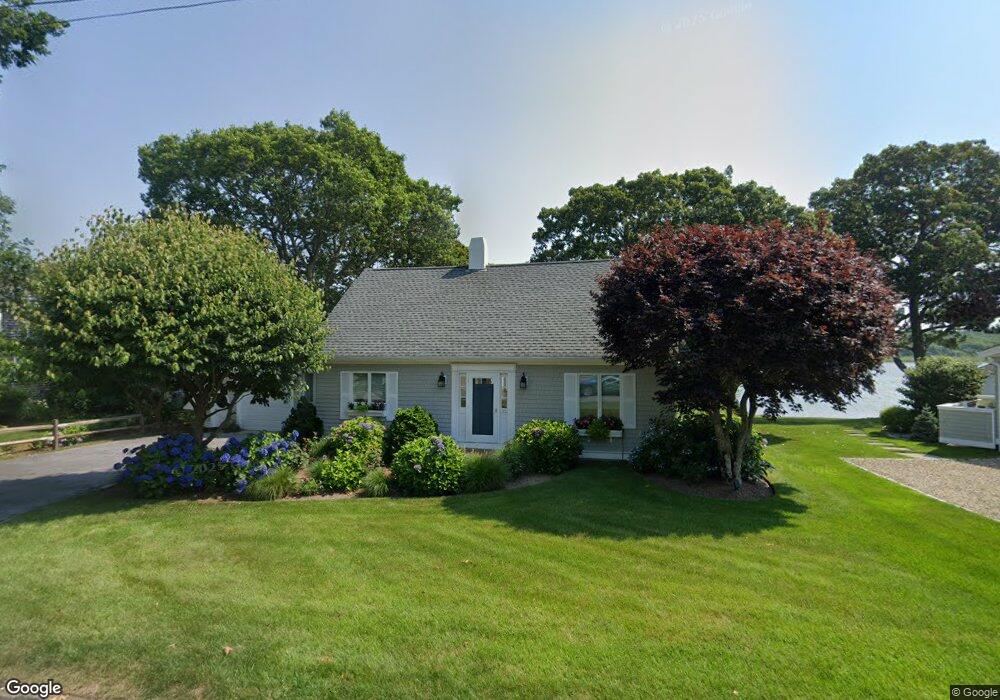
35 East Ave Marion, MA 02738
Estimated Value: $1,362,000 - $2,088,000
3
Beds
2
Baths
1,849
Sq Ft
$897/Sq Ft
Est. Value
About This Home
This home is located at 35 East Ave, Marion, MA 02738 and is currently estimated at $1,658,588, approximately $897 per square foot. 35 East Ave is a home located in Plymouth County with nearby schools including Old Rochester Regional High School.
Ownership History
Date
Name
Owned For
Owner Type
Purchase Details
Closed on
Nov 17, 2014
Sold by
Cuzzi Barbara G
Bought by
Barbara L Grainger T L and Barbara Cuzzi
Current Estimated Value
Purchase Details
Closed on
Feb 18, 2005
Sold by
Grainger Jacobs S
Bought by
Grainger Barbara L
Purchase Details
Closed on
May 2, 1990
Sold by
Patterson Prop T
Bought by
Grainger Jacob S
Home Financials for this Owner
Home Financials are based on the most recent Mortgage that was taken out on this home.
Original Mortgage
$260,000
Interest Rate
10.18%
Mortgage Type
Purchase Money Mortgage
Create a Home Valuation Report for This Property
The Home Valuation Report is an in-depth analysis detailing your home's value as well as a comparison with similar homes in the area
Purchase History
| Date | Buyer | Sale Price | Title Company |
|---|---|---|---|
| Barbara L Grainger T L | -- | -- | |
| Grainger Barbara L | -- | -- | |
| Grainger Jacob S | $325,000 | -- |
Source: Public Records
Mortgage History
| Date | Status | Borrower | Loan Amount |
|---|---|---|---|
| Previous Owner | Grainger Jacob S | $260,000 |
Source: Public Records
Tax History
| Year | Tax Paid | Tax Assessment Tax Assessment Total Assessment is a certain percentage of the fair market value that is determined by local assessors to be the total taxable value of land and additions on the property. | Land | Improvement |
|---|---|---|---|---|
| 2025 | $15,771 | $1,692,215 | $1,332,715 | $359,500 |
| 2024 | $14,503 | $1,566,228 | $1,216,828 | $349,400 |
| 2023 | $12,912 | $1,367,815 | $1,046,215 | $321,600 |
| 2022 | $16,084 | $1,482,370 | $1,164,470 | $317,900 |
| 2021 | $15,380 | $1,358,681 | $1,052,781 | $305,900 |
| 2020 | $13,261 | $1,133,400 | $840,400 | $293,000 |
| 2019 | $11,672 | $1,058,200 | $765,200 | $293,000 |
| 2018 | $12,510 | $1,092,600 | $837,500 | $255,100 |
| 2017 | $12,349 | $1,082,300 | $837,500 | $244,800 |
| 2016 | $12,227 | $1,081,100 | $837,500 | $243,600 |
| 2015 | $12,200 | $1,098,100 | $833,800 | $264,300 |
Source: Public Records
Map
Nearby Homes
- 56 E Ave & Lot 27 West Ave
- 25 West Ave
- 414 Point Rd
- 44 Register Rd
- 0 Register Rd
- 58 Delano Rd
- 16 Spinnaker Ln
- 85 Moorings Rd
- 16 Vine St
- 174 Cross Neck Rd
- 65 Olde Knoll Rd
- 13 Cottage St
- 701 Mill St
- 9 Deer Run
- 7 Cedar St
- 0 Cross Neck Rd Unit 73420524
- 0 Cross Neck Rd Unit 73466177
- 0 Cross Neck Rd Unit 73420525
- 298 Front St
- 3 Bass Point Rd
Your Personal Tour Guide
Ask me questions while you tour the home.