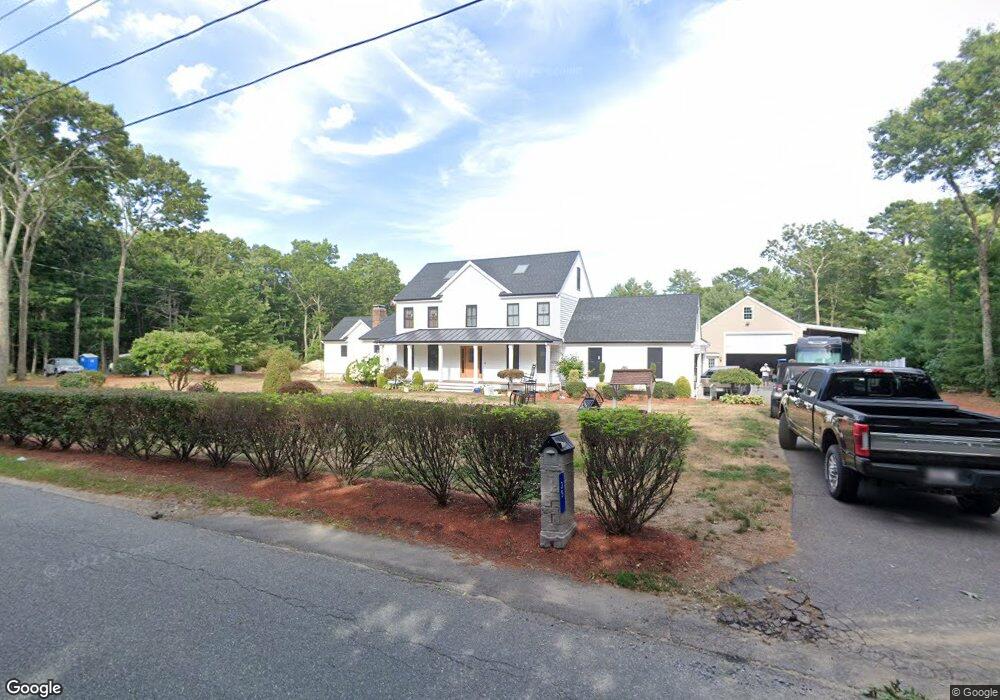
35 Forrest St Berkley, MA 02779
Estimated Value: $726,000 - $823,000
4
Beds
3
Baths
2,264
Sq Ft
$347/Sq Ft
Est. Value
About This Home
This home is located at 35 Forrest St, Berkley, MA 02779 and is currently estimated at $784,552, approximately $346 per square foot. 35 Forrest St is a home located in Bristol County with nearby schools including Berkley Community School.
Ownership History
Date
Name
Owned For
Owner Type
Purchase Details
Closed on
Mar 28, 2008
Sold by
Nordeste 4Th John C and Nordeste Tina L
Bought by
Mongeon Robert
Current Estimated Value
Home Financials for this Owner
Home Financials are based on the most recent Mortgage that was taken out on this home.
Original Mortgage
$306,000
Outstanding Balance
$191,705
Interest Rate
5.76%
Mortgage Type
Purchase Money Mortgage
Estimated Equity
$592,847
Create a Home Valuation Report for This Property
The Home Valuation Report is an in-depth analysis detailing your home's value as well as a comparison with similar homes in the area
Purchase History
| Date | Buyer | Sale Price | Title Company |
|---|---|---|---|
| Mongeon Robert | $340,000 | -- |
Source: Public Records
Mortgage History
| Date | Status | Borrower | Loan Amount |
|---|---|---|---|
| Open | Mongeon Robert | $306,000 |
Source: Public Records
Tax History
| Year | Tax Paid | Tax Assessment Tax Assessment Total Assessment is a certain percentage of the fair market value that is determined by local assessors to be the total taxable value of land and additions on the property. | Land | Improvement |
|---|---|---|---|---|
| 2025 | $87 | $726,700 | $159,000 | $567,700 |
| 2024 | $7,717 | $619,800 | $137,000 | $482,800 |
| 2023 | $7,309 | $552,900 | $137,000 | $415,900 |
| 2022 | $7,160 | $520,700 | $119,200 | $401,500 |
| 2021 | $6,987 | $489,300 | $113,500 | $375,800 |
| 2020 | $6,992 | $481,200 | $100,400 | $380,800 |
| 2019 | $6,803 | $464,700 | $100,400 | $364,300 |
| 2018 | $6,257 | $446,300 | $96,600 | $349,700 |
| 2017 | $6,012 | $420,400 | $108,200 | $312,200 |
| 2016 | $5,819 | $392,100 | $108,200 | $283,900 |
| 2015 | $5,471 | $393,300 | $108,200 | $285,100 |
| 2014 | $4,663 | $364,000 | $117,400 | $246,600 |
Source: Public Records
Map
Nearby Homes
- LOT 0 B Hudson Dr Unit B
- 2 Lima Ln
- LOT 0 B Hudson Dr Unit B
- 2 Bc Ln
- 1064 Somerset Ave
- 31 Swing Dr
- 300 Country Hill Dr
- 1721-1731 Somerset Ave
- 547 Berkley St
- 729 Center St
- 106 Seymour St
- 1022 Rowland Dr
- 627 School St
- 810 Tremont St
- 24 Orchard St
- 8 Ferry Ln
- 2 Waterford Cir
- 23 Elmwood Dr
- 86 Cranesbill Rd
- 852 Somerset Ave
Your Personal Tour Guide
Ask me questions while you tour the home.