35 Gray St Boston, MA 02116
South End NeighborhoodEstimated Value: $2,482,385 - $3,341,000
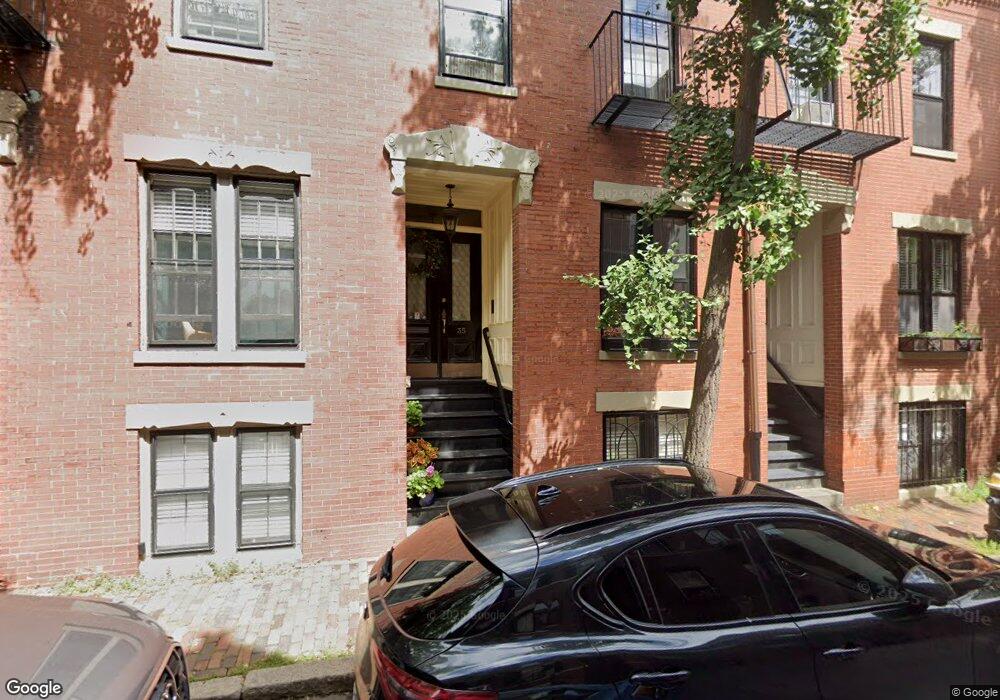
About This Home
This home is located at 35 Gray St, Boston, MA 02116 and is currently estimated at $2,746,596, approximately $1,436 per square foot. 35 Gray St is a home located in Suffolk County with nearby schools including Blackstone Elementary, Charles H. Taylor Elementary School, and Beethoven Elementary School.
Ownership History
We collect this data history from publicly available records. To have your information removed, we recommend requesting removal directly through your county’s website.
Purchase Details
Purchase Details
Purchase Details
Home Values in the Area
Average Home Value in this Area
Purchase History
We collect this data history from publicly available records. To have your information removed, we recommend requesting removal directly through your county’s website.
| Date | Buyer | Sale Price | Title Company |
|---|---|---|---|
| $689,000 | -- | ||
| $675,000 | -- | ||
| $305,000 | -- |
Mortgage History
We collect this data history from publicly available records. To have your information removed, we recommend requesting removal directly through your county’s website.
| Date | Status | Borrower | Loan Amount |
|---|---|---|---|
| Open | $249,000 | ||
| Open | $395,000 | ||
| Closed | $385,000 | ||
| Closed | $114,750 | ||
| Closed | $407,000 | ||
| Closed | $116,750 | ||
| Closed | $417,000 | ||
| Closed | $548,000 | ||
| Closed | $625,000 | ||
| Closed | $629,000 | ||
| Closed | $551,200 | ||
| Previous Owner | $206,000 | ||
| Previous Owner | $239,000 |
Tax History
We collect this data history from publicly available records. To have your information removed, we recommend requesting removal directly through your county’s website.
| Year | Tax Paid | Tax Assessment Tax Assessment Total Assessment is a certain percentage of the fair market value that is determined by local assessors to be the total taxable value of land and additions on the property. | Land | Improvement |
|---|---|---|---|---|
| 2025 | $21,885 | $1,889,900 | $646,600 | $1,243,300 |
| 2024 | $20,076 | $1,841,800 | $519,800 | $1,322,000 |
| 2023 | $19,022 | $1,771,100 | $499,800 | $1,271,300 |
| 2022 | $18,535 | $1,703,600 | $480,800 | $1,222,800 |
| 2021 | $17,149 | $1,607,200 | $453,600 | $1,153,600 |
| 2020 | $16,465 | $1,559,200 | $416,500 | $1,142,700 |
| 2019 | $15,960 | $1,514,200 | $344,900 | $1,169,300 |
| 2018 | $15,412 | $1,470,600 | $344,900 | $1,125,700 |
| 2017 | $14,825 | $1,399,900 | $344,900 | $1,055,000 |
| 2016 | $14,127 | $1,284,300 | $344,900 | $939,400 |
| 2015 | $14,442 | $1,192,600 | $283,800 | $908,800 |
| 2014 | $13,485 | $1,071,900 | $283,800 | $788,100 |
Map
- 8 Lawrence St
- 53 Chandler St Unit 3
- 74 Appleton St Unit 4
- 9 Appleton St Unit 208
- 9 Appleton St Unit M2
- 15 Cazenove St Unit 1
- 7 Warren Ave Unit 6
- 70 Clarendon St Unit A
- 80 Appleton St Unit 80
- 109 Chandler St Unit 1
- 3 Appleton St Unit 101
- 3 Appleton St Unit 505
- 505 Tremont St Unit 613
- 505 Tremont St Unit 811
- 285 Columbus Ave Unit 805
- 11 Dartmouth Place Unit 11-2
- 109 Appleton St
- 312 Columbus Ave Unit 4
- 110 Appleton St
- 219-223 Columbus Ave Unit 203
- 10 Lawrence St Unit 2
- 10 Lawrence St Unit 1
- 11 Lawrence St
- 9 Lawrence St
- 8 Lawrence St Unit 2
- 8 Lawrence St Unit 1
- 12 Lawrence St Unit 2
- 12 Lawrence St Unit 1
- 12 Lawrence St Unit D
- 12 Lawrence St Unit 12 C
- 12 Lawrence St
- 12 Lawrence St Unit E
- 12 Lawrence St Unit C
- 12 Lawrence St Unit 3
- 12 1/2 Lawrence St
- 7 Lawrence St
- 7 Lawrence St Unit 2
- 7 Lawrence St Unit TH
- 31 Appleton St
- 14 Lawrence St Unit 2
Ask me questions while you tour the home.