35 Macarthur Cir Peabody, MA 01960
South Peabody NeighborhoodEstimated Value: $705,000 - $945,700
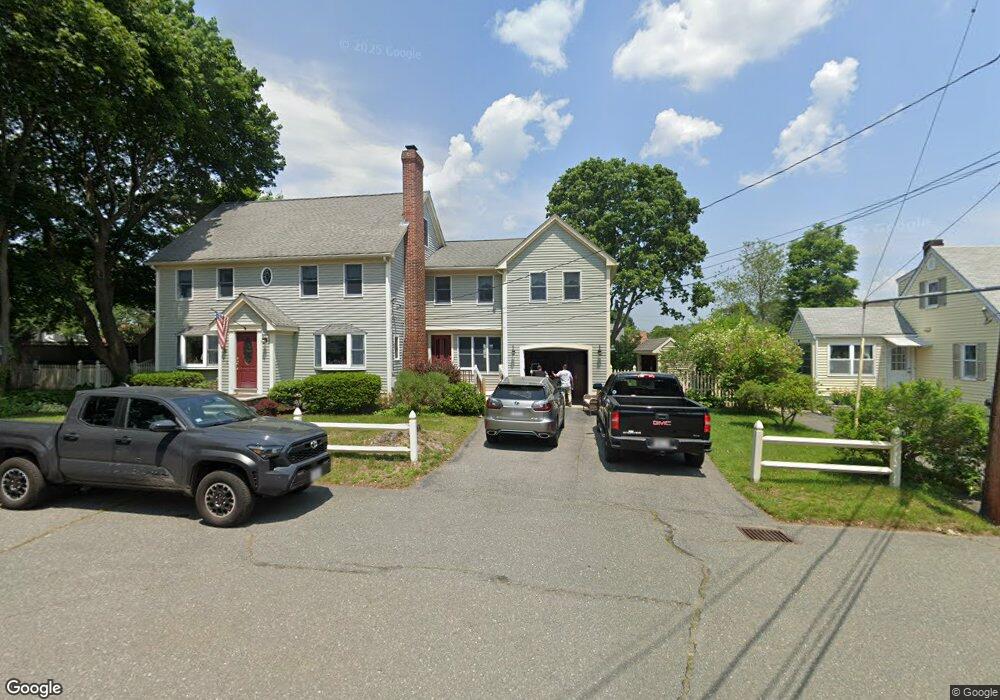
About This Home
This home is located at 35 Macarthur Cir, Peabody, MA 01960 and is currently estimated at $846,175, approximately $333 per square foot. 35 Macarthur Cir is a home located in Essex County with nearby schools including Peabody Veterans Memorial High School, North Shore Christian School, and St John The Baptist School.
Ownership History
We collect this data history from publicly available records. To have your information removed, we recommend requesting removal directly through your county’s website.
Purchase Details
Purchase Details
Purchase Details
Home Values in the Area
Average Home Value in this Area
Purchase History
We collect this data history from publicly available records. To have your information removed, we recommend requesting removal directly through your county’s website.
| Date | Buyer | Sale Price | Title Company |
|---|---|---|---|
| -- | None Available | ||
| -- | None Available | ||
| $162,000 | -- | ||
| $158,500 | -- | ||
| $162,000 | -- | ||
| $158,500 | -- |
Mortgage History
We collect this data history from publicly available records. To have your information removed, we recommend requesting removal directly through your county’s website.
| Date | Status | Borrower | Loan Amount |
|---|---|---|---|
| Previous Owner | $120,000 | ||
| Previous Owner | $142,000 |
Tax History
We collect this data history from publicly available records. To have your information removed, we recommend requesting removal directly through your county’s website.
| Year | Tax Paid | Tax Assessment Tax Assessment Total Assessment is a certain percentage of the fair market value that is determined by local assessors to be the total taxable value of land and additions on the property. | Land | Improvement |
|---|---|---|---|---|
| 2025 | $8,065 | $870,900 | $249,200 | $621,700 |
| 2024 | $7,831 | $858,700 | $249,200 | $609,500 |
| 2023 | $7,073 | $743,000 | $222,600 | $520,400 |
| 2022 | $7,057 | $698,700 | $198,800 | $499,900 |
| 2021 | $7,020 | $669,200 | $180,700 | $488,500 |
| 2020 | $7,126 | $663,500 | $180,700 | $482,800 |
| 2019 | $6,542 | $594,200 | $180,700 | $413,500 |
| 2018 | $6,635 | $579,000 | $164,300 | $414,700 |
| 2017 | $6,342 | $539,300 | $164,300 | $375,000 |
| 2016 | $6,425 | $539,000 | $164,300 | $374,700 |
| 2015 | $6,317 | $513,600 | $160,200 | $353,400 |
Map
- 153 Lynn St
- 12 Johnson Ave
- 23 Batchelder Ave
- 2 Johnson Ave
- 31 Stearns Place
- 29 Rockway Rd
- 24 Stearns Place
- 18 Strongwater Dr
- 23 Strongwater Dr
- 17 Strongwater Dr
- 300 Lynn St
- 4 Calas Cir
- 20 Gedney Dr
- 19 Olde Village Dr Unit 1603
- 17 Lions Ln Unit 2005
- 131 Range Heights Rd
- 4 Countryside Ln
- 38 Sandra Rd
- 51 Broadway
- 60 Broadway
Ask me questions while you tour the home.