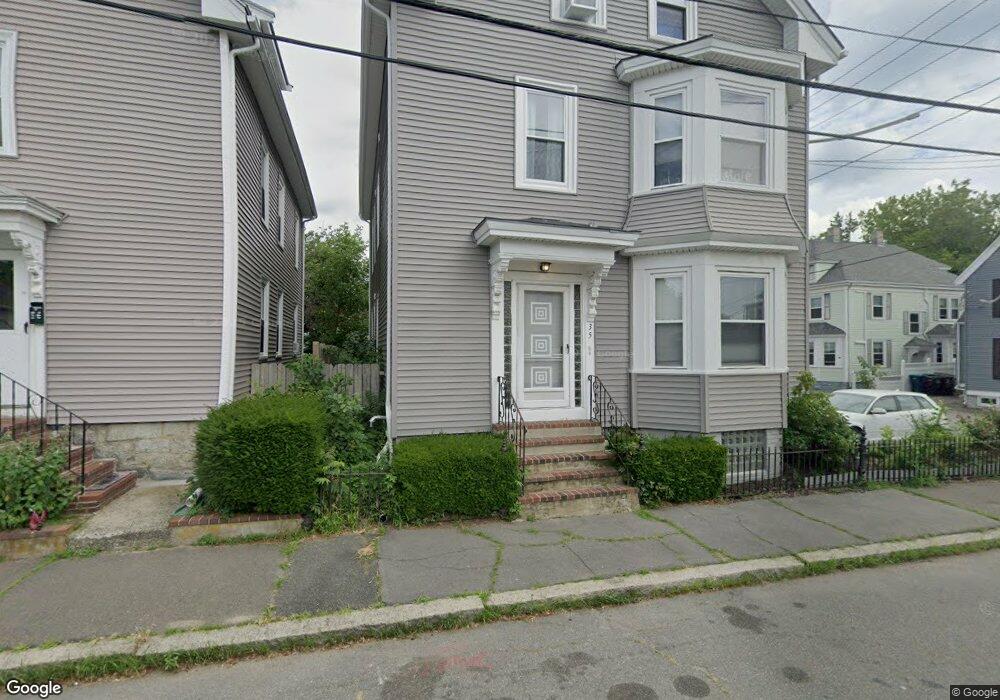
35 Osgood St Salem, MA 01970
Bridge Street NeighborhoodEstimated Value: $807,196 - $872,000
4
Beds
3
Baths
3,016
Sq Ft
$279/Sq Ft
Est. Value
About This Home
This home is located at 35 Osgood St, Salem, MA 01970 and is currently estimated at $840,049, approximately $278 per square foot. 35 Osgood St is a home located in Essex County with nearby schools including Carlton Elementary School, Saltonstall School, and Bates Elementary School.
Ownership History
Date
Name
Owned For
Owner Type
Purchase Details
Closed on
Mar 21, 2006
Sold by
Perkins Donald J and Lauranzano Laura J
Bought by
Lauranzano Laura J
Current Estimated Value
Purchase Details
Closed on
Feb 9, 1994
Sold by
Collette Kathleen
Bought by
Perkins Donald
Create a Home Valuation Report for This Property
The Home Valuation Report is an in-depth analysis detailing your home's value as well as a comparison with similar homes in the area
Home Values in the Area
Average Home Value in this Area
Purchase History
We collect this data history from publicly available records. To have your information removed, we recommend requesting removal directly through your county’s website.
| Date | Buyer | Sale Price | Title Company |
|---|---|---|---|
| Lauranzano Laura J | -- | -- | |
| Perkins Donald | $45,000 | -- | |
| Perkins Donald J | $45,000 | -- | |
| Perkins Donald J | $44,500 | -- |
Source: Public Records
Mortgage History
We collect this data history from publicly available records. To have your information removed, we recommend requesting removal directly through your county’s website.
| Date | Status | Borrower | Loan Amount |
|---|---|---|---|
| Open | Perkins Donald J | $50,000 | |
| Open | Perkins Donald J | $264,000 | |
| Closed | Perkins Donald J | $219,000 |
Source: Public Records
Tax History
| Year | Tax Paid | Tax Assessment Tax Assessment Total Assessment is a certain percentage of the fair market value that is determined by local assessors to be the total taxable value of land and additions on the property. | Land | Improvement |
|---|---|---|---|---|
| 2025 | $8,166 | $720,100 | $163,800 | $556,300 |
| 2024 | $7,548 | $649,600 | $155,200 | $494,400 |
| 2023 | $7,346 | $587,200 | $143,700 | $443,500 |
| 2022 | $7,269 | $548,600 | $135,100 | $413,500 |
| 2021 | $7,015 | $508,300 | $135,100 | $373,200 |
| 2020 | $6,294 | $435,600 | $116,700 | $318,900 |
| 2019 | $6,238 | $413,100 | $110,900 | $302,200 |
| 2018 | $5,761 | $374,600 | $105,800 | $268,800 |
| 2017 | $5,365 | $338,300 | $86,200 | $252,100 |
| 2016 | $5,229 | $333,700 | $81,600 | $252,100 |
| 2015 | $5,069 | $308,900 | $73,600 | $235,300 |
Source: Public Records
Map
Nearby Homes
- 11 Barton St
- 6 Pearl St
- 106 Bridge St Unit 7
- 16 Pleasant St
- 7 Oliver St
- 1 English St
- 1 Boardman St Unit 6
- 26 Essex St Unit 2
- 33 Essex St Unit 1
- 49 Essex St Unit 2R
- 49 Essex St Unit 1L
- 121 Water St Unit 46
- 109 Water St Unit 404
- 96 Derby St Unit 1
- 16 Franklin St Unit 1303
- 16 Franklin St Unit 2401
- 12 Summit Ave Unit 6
- 115 Water St Unit 14
- 57 Front St Unit 2
- 125 Derby St Unit D
- 17 Osgood St
- 19R Osgood St
- 15 Osgood St
- 15 Osgood St
- 15 Osgood St Unit 1
- 19 Osgood St
- 19 Osgood St Unit 1
- 19 Osgood St Unit 2
- 13 Osgood St Unit 2
- 13 Osgood St
- 13 Osgood St Unit 1
- 8 Planters St
- 6 Planters St
- 25 Osgood St
- 14 Osgood St
- 18 Osgood St
- 7 Osgood St
- 12 1/2 Osgood St
- 12 Osgood St
- 4 Planters St
Your Personal Tour Guide
Ask me questions while you tour the home.