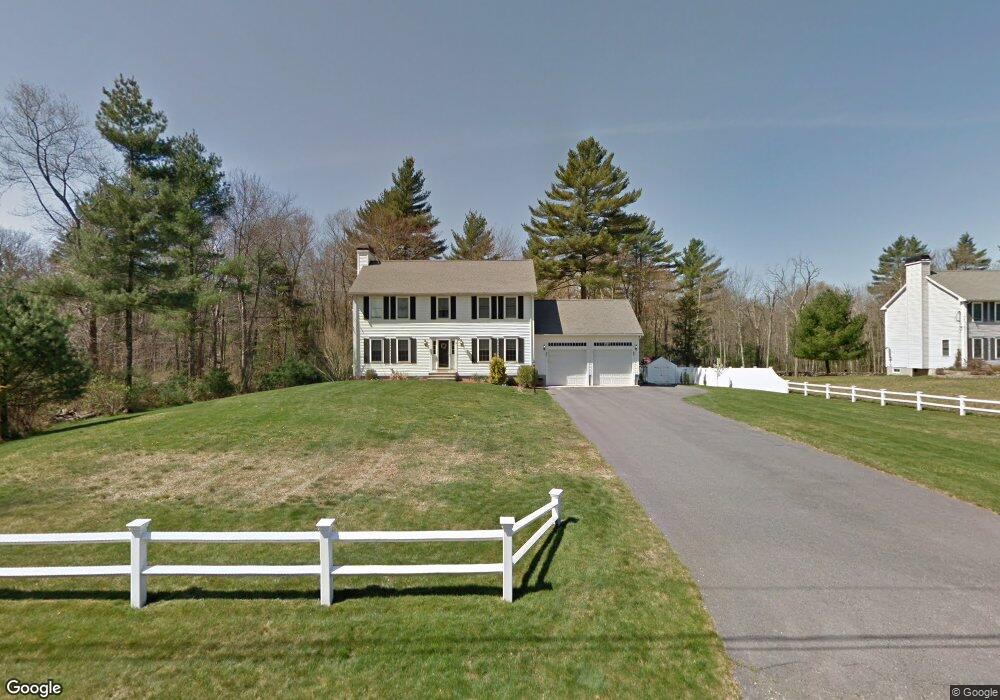
35 Parsons Walk Berkley, MA 02779
Berkley Bridge/Lower Berkley NeighborhoodEstimated Value: $704,658 - $849,000
3
Beds
3
Baths
2,800
Sq Ft
$275/Sq Ft
Est. Value
About This Home
This home is located at 35 Parsons Walk, Berkley, MA 02779 and is currently estimated at $770,665, approximately $275 per square foot. 35 Parsons Walk is a home located in Bristol County with nearby schools including Berkley Community School.
Ownership History
Date
Name
Owned For
Owner Type
Purchase Details
Closed on
Jun 25, 2010
Sold by
Reilly Daniel S and Reilly Melissa B
Bought by
Andrews Patrick T
Current Estimated Value
Home Financials for this Owner
Home Financials are based on the most recent Mortgage that was taken out on this home.
Original Mortgage
$373,964
Outstanding Balance
$249,792
Interest Rate
4.98%
Mortgage Type
Purchase Money Mortgage
Estimated Equity
$520,873
Purchase Details
Closed on
Feb 24, 2003
Sold by
Padelford Investor Inc
Bought by
Reilly Daniel S and Reilly Melissa B
Home Financials for this Owner
Home Financials are based on the most recent Mortgage that was taken out on this home.
Original Mortgage
$223,450
Interest Rate
5.98%
Mortgage Type
Purchase Money Mortgage
Create a Home Valuation Report for This Property
The Home Valuation Report is an in-depth analysis detailing your home's value as well as a comparison with similar homes in the area
Home Values in the Area
Average Home Value in this Area
Purchase History
| Date | Buyer | Sale Price | Title Company |
|---|---|---|---|
| Andrews Patrick T | $379,000 | -- | |
| Reilly Daniel S | $279,313 | -- |
Source: Public Records
Mortgage History
| Date | Status | Borrower | Loan Amount |
|---|---|---|---|
| Open | Andrews Patrick T | $373,964 | |
| Previous Owner | Reilly Daniel S | $223,450 |
Source: Public Records
Tax History
| Year | Tax Paid | Tax Assessment Tax Assessment Total Assessment is a certain percentage of the fair market value that is determined by local assessors to be the total taxable value of land and additions on the property. | Land | Improvement |
|---|---|---|---|---|
| 2025 | $7,111 | $592,100 | $175,000 | $417,100 |
| 2024 | $6,894 | $553,700 | $153,000 | $400,700 |
| 2023 | $6,486 | $490,600 | $153,000 | $337,600 |
| 2022 | $6,340 | $461,100 | $135,200 | $325,900 |
| 2021 | $6,170 | $432,100 | $129,500 | $302,600 |
| 2020 | $6,161 | $424,000 | $116,400 | $307,600 |
| 2019 | $5,980 | $408,500 | $116,400 | $292,100 |
| 2018 | $5,479 | $390,800 | $112,600 | $278,200 |
| 2017 | $5,265 | $368,200 | $124,200 | $244,000 |
| 2016 | $5,084 | $342,600 | $124,200 | $218,400 |
| 2015 | $4,768 | $342,800 | $124,200 | $218,600 |
| 2014 | $4,539 | $354,300 | $133,400 | $220,900 |
Source: Public Records
Map
Nearby Homes
- LOT 0 B Hudson Dr Unit B
- 2 Lima Ln
- LOT 0 B Hudson Dr Unit B
- 2 Bc Ln
- 24 Orchard St
- 66 S Main St
- 106 Seymour St
- 23 Elmwood Dr
- 1969 County St
- 547 Berkley St
- 10 W Cudworth Ave
- 71 Tania Dr
- 65 & 65R Williams Ave
- 3 Karena Dr Unit 4-21
- 800 County St Unit 23
- 1064 Somerset Ave
- 31 Swing Dr
- 15 Hart St
- 300 Country Hill Dr
- 53 Woodlawn St
- 33 Parsons Walk
- 37 Parsons Walk
- 30 Parsons Walk
- 32 Parsons Walk
- 39 Parsons Walk
- 31 Parsons Walk
- 28 Parsons Walk
- 34 Parsons Walk
- 36 Parsons Walk
- 27 Parsons Walk
- 38 Parsons Walk
- 41 Parsons Walk
- 26 Parsons Walk
- 25 Parson's Walk
- 25 Parsons Walk
- 47 Parsons Walk
- 34 Locust St
- 53 Parsons Walk
- 49 Parsons Walk
- 42 Locust St
Your Personal Tour Guide
Ask me questions while you tour the home.