35 Prospect St Rockland, MA 02370
Estimated Value: $565,000 - $632,000
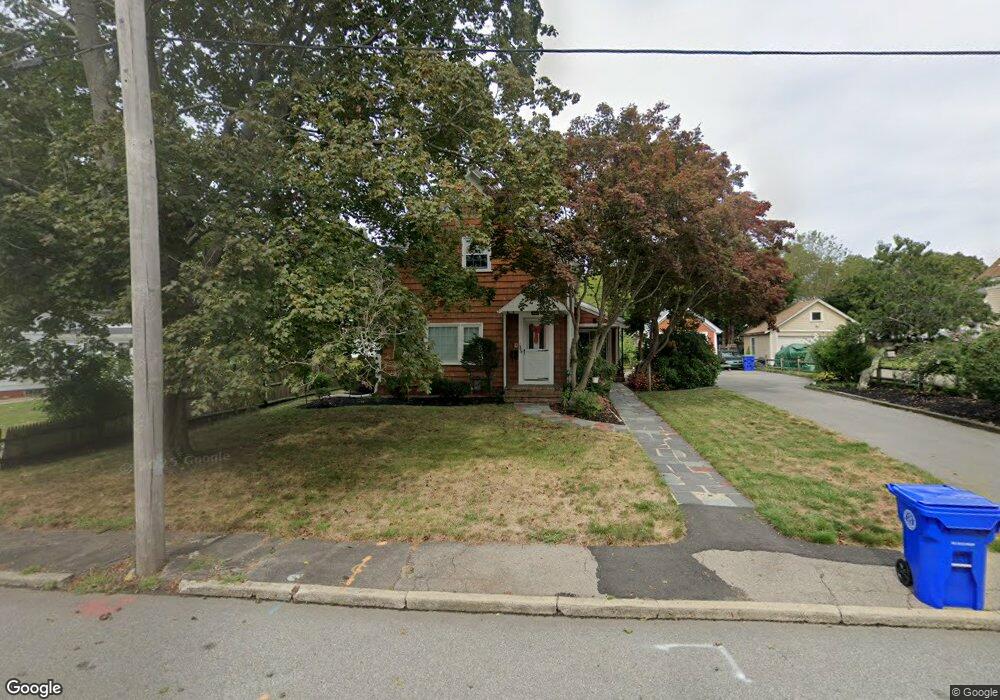
About This Home
This home is located at 35 Prospect St, Rockland, MA 02370 and is currently estimated at $602,487, approximately $374 per square foot. 35 Prospect St is a home located in Plymouth County with nearby schools including Rockland Senior High School, Calvary Chapel Academy, and St Bridget School.
Ownership History
We collect this data history from publicly available records. To have your information removed, we recommend requesting removal directly through your county’s website.
Purchase Details
Purchase Details
Home Values in the Area
Average Home Value in this Area
Purchase History
We collect this data history from publicly available records. To have your information removed, we recommend requesting removal directly through your county’s website.
| Date | Buyer | Sale Price | Title Company |
|---|---|---|---|
| -- | -- | ||
| -- | -- |
Mortgage History
We collect this data history from publicly available records. To have your information removed, we recommend requesting removal directly through your county’s website.
| Date | Status | Borrower | Loan Amount |
|---|---|---|---|
| Previous Owner | $40,000 |
Tax History
We collect this data history from publicly available records. To have your information removed, we recommend requesting removal directly through your county’s website.
| Year | Tax Paid | Tax Assessment Tax Assessment Total Assessment is a certain percentage of the fair market value that is determined by local assessors to be the total taxable value of land and additions on the property. | Land | Improvement |
|---|---|---|---|---|
| 2025 | $6,902 | $504,900 | $227,200 | $277,700 |
| 2024 | $6,702 | $476,700 | $214,400 | $262,300 |
| 2023 | $6,516 | $428,100 | $186,800 | $241,300 |
| 2022 | $6,246 | $372,900 | $162,400 | $210,500 |
| 2021 | $5,735 | $331,900 | $147,700 | $184,200 |
| 2020 | $5,383 | $307,600 | $140,700 | $166,900 |
| 2019 | $5,297 | $295,600 | $134,000 | $161,600 |
| 2018 | $5,023 | $275,700 | $134,000 | $141,700 |
| 2017 | $4,742 | $256,600 | $126,900 | $129,700 |
| 2016 | $4,565 | $246,900 | $122,000 | $124,900 |
| 2015 | $4,565 | $239,900 | $114,100 | $125,800 |
| 2014 | $4,317 | $235,400 | $111,900 | $123,500 |
Map
- 48 Union St
- 62-64 W Water St
- 135 Grove St Unit 111
- 135 Grove St Unit 115
- 135 Grove St Unit 112
- 119 Grove St Unit 234
- 119 Grove St Unit 216
- 83 Union St
- 12 Linden St
- 22 Brookside Rd
- 28 Blanchard St
- 107 E Water St
- 181 Central St
- 49 Custer St
- 251 Central St
- 364 North Ave
- 75 Willow Pond Dr
- 27 Stanton St
- 4 Birch St
- 173 Liberty St
- 43 Prospect St
- 25 Prospect St
- 34 William St
- 24 William St
- 38 William St Unit 40
- 17 Prospect St
- 49 Prospect St
- 49 Prospect St Unit 1
- 16 William St
- 48 William St
- 44 Prospect St Unit 2
- 44 Prospect St
- 34 Prospect St
- 24 Prospect St
- 29 Williams St
- 8 William St
- 52 Prospect St
- 55 Prospect St
- 29 William St
- 20 Prospect St
Ask me questions while you tour the home.