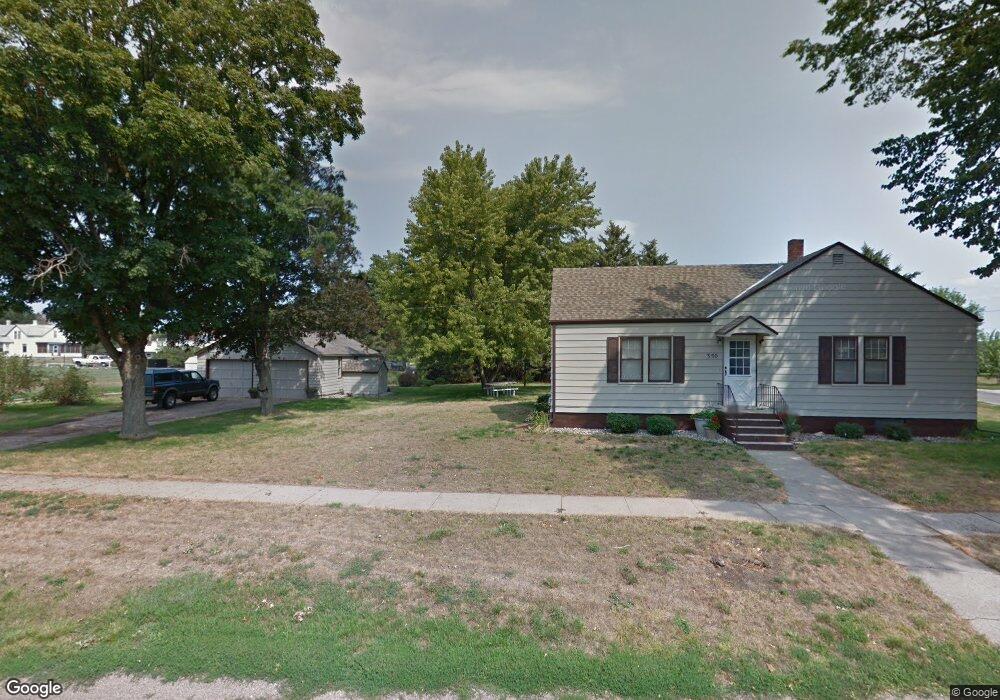
350 E 3rd St Pilger, NE 68768
Estimated Value: $144,000 - $198,000
2
Beds
2
Baths
1,484
Sq Ft
$118/Sq Ft
Est. Value
About This Home
This home is located at 350 E 3rd St, Pilger, NE 68768 and is currently estimated at $174,515, approximately $117 per square foot. 350 E 3rd St is a home located in Stanton County with nearby schools including Wisner-Pilger Elementary School, Wisner-Pilger Middle School, and Wisner-Pilger High School.
Ownership History
Date
Name
Owned For
Owner Type
Purchase Details
Closed on
Apr 3, 2024
Sold by
Tinker Timothy N
Bought by
Vesely Jonathan
Current Estimated Value
Home Financials for this Owner
Home Financials are based on the most recent Mortgage that was taken out on this home.
Original Mortgage
$157,000
Outstanding Balance
$154,247
Interest Rate
6.94%
Mortgage Type
New Conventional
Estimated Equity
$20,268
Purchase Details
Closed on
Aug 17, 2015
Sold by
Koehlmoos Leroy L and Koehlmoos Lynn M
Bought by
Tinker Timothy N
Create a Home Valuation Report for This Property
The Home Valuation Report is an in-depth analysis detailing your home's value as well as a comparison with similar homes in the area
Purchase History
| Date | Buyer | Sale Price | Title Company |
|---|---|---|---|
| Vesely Jonathan | $182,000 | Stewart Title | |
| Tinker Timothy N | $4,000 | Ne Ne Title & Escrow |
Source: Public Records
Mortgage History
| Date | Status | Borrower | Loan Amount |
|---|---|---|---|
| Open | Vesely Jonathan | $157,000 |
Source: Public Records
Tax History
| Year | Tax Paid | Tax Assessment Tax Assessment Total Assessment is a certain percentage of the fair market value that is determined by local assessors to be the total taxable value of land and additions on the property. | Land | Improvement |
|---|---|---|---|---|
| 2025 | $2,927 | $230,045 | $13,600 | $216,445 |
| 2024 | $2,583 | $186,195 | $7,785 | $178,410 |
| 2023 | $2,484 | $143,230 | $5,990 | $137,240 |
| 2022 | $1,189 | $135,505 | $5,990 | $129,515 |
| 2021 | $2,311 | $125,540 | $5,990 | $119,550 |
| 2020 | $1,902 | $96,275 | $6,720 | $89,555 |
| 2019 | $1,897 | $93,755 | $4,200 | $89,555 |
| 2018 | $1,833 | $93,755 | $4,200 | $89,555 |
| 2017 | $1,849 | $93,755 | $4,200 | $89,555 |
| 2016 | $1,402 | $0 | $0 | $0 |
| 2015 | $112 | $4,200 | $4,200 | $0 |
| 2014 | $1,306 | $52,100 | $4,200 | $47,900 |
| 2013 | -- | $56,610 | $4,565 | $52,045 |
Source: Public Records
Map
Nearby Homes
Your Personal Tour Guide
Ask me questions while you tour the home.