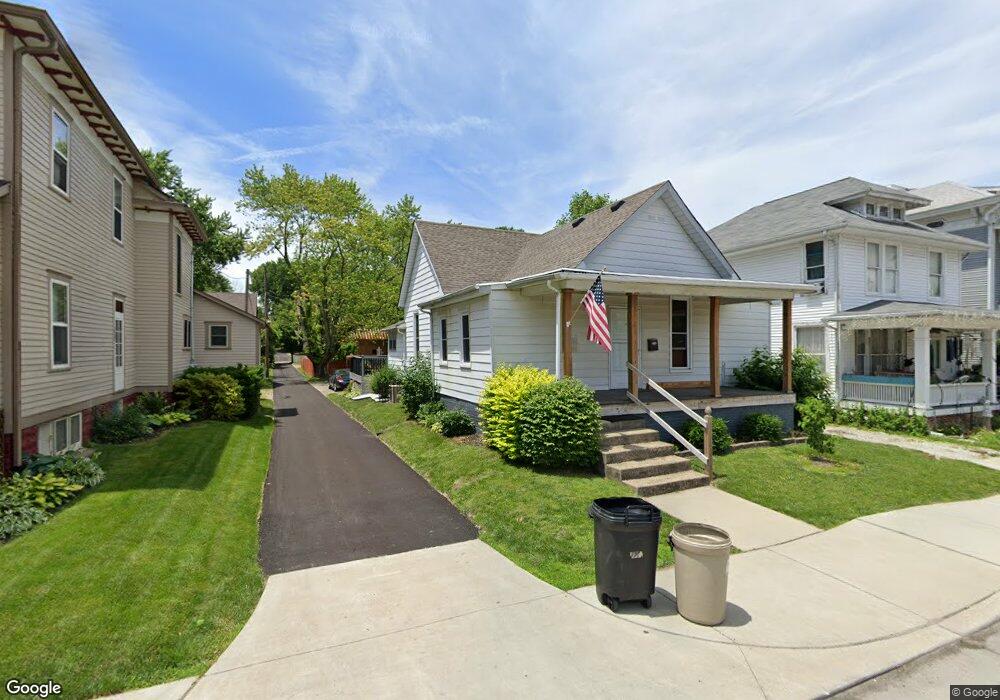
350 N Main St Franklin, IN 46131
Estimated Value: $189,000 - $217,000
3
Beds
2
Baths
1,336
Sq Ft
$150/Sq Ft
Est. Value
About This Home
This home is located at 350 N Main St, Franklin, IN 46131 and is currently estimated at $200,289, approximately $149 per square foot. 350 N Main St is a home located in Johnson County with nearby schools including Northwood Elementary School, Franklin Community Middle School, and Custer Baker Intermediate School.
Ownership History
Date
Name
Owned For
Owner Type
Purchase Details
Closed on
Dec 5, 2023
Sold by
Atwood Gary and Atwood Lisa K
Bought by
Atwood Christopher and Atwood Michelle
Current Estimated Value
Purchase Details
Closed on
Aug 1, 2023
Sold by
Atwood Erik and Atwood Gary Lee
Bought by
Atwood Gary and Atwood Lisa Kay
Home Financials for this Owner
Home Financials are based on the most recent Mortgage that was taken out on this home.
Original Mortgage
$100,000
Interest Rate
6.67%
Mortgage Type
New Conventional
Purchase Details
Closed on
Jun 10, 2019
Sold by
Atwood Erik
Bought by
Atwood Erik and Atwood Gary Lee
Purchase Details
Closed on
Oct 20, 2005
Sold by
Wenning Louis E
Bought by
Atwood Erik
Home Financials for this Owner
Home Financials are based on the most recent Mortgage that was taken out on this home.
Original Mortgage
$65,600
Interest Rate
5.89%
Mortgage Type
New Conventional
Create a Home Valuation Report for This Property
The Home Valuation Report is an in-depth analysis detailing your home's value as well as a comparison with similar homes in the area
Home Values in the Area
Average Home Value in this Area
Purchase History
We collect this data history from publicly available records. To have your information removed, we recommend requesting removal directly through your county’s website.
| Date | Buyer | Sale Price | Title Company |
|---|---|---|---|
| Atwood Christopher | -- | None Listed On Document | |
| Atwood Gary | -- | Security Title | |
| Atwood Erik | -- | None Available | |
| Atwood Erik | -- | Stewart Title Services Of Ce | |
| Atwood Erik | -- | None Available |
Source: Public Records
Mortgage History
We collect this data history from publicly available records. To have your information removed, we recommend requesting removal directly through your county’s website.
| Date | Status | Borrower | Loan Amount |
|---|---|---|---|
| Previous Owner | Atwood Gary | $100,000 | |
| Previous Owner | Atwood Erik | $16,400 | |
| Previous Owner | Atwood Erik | $65,600 |
Source: Public Records
Tax History
| Year | Tax Paid | Tax Assessment Tax Assessment Total Assessment is a certain percentage of the fair market value that is determined by local assessors to be the total taxable value of land and additions on the property. | Land | Improvement |
|---|---|---|---|---|
| 2025 | $1,455 | $153,300 | $19,700 | $133,600 |
| 2024 | $1,811 | $165,500 | $19,700 | $145,800 |
| 2023 | $1,665 | $151,600 | $19,700 | $131,900 |
| 2022 | $1,512 | $138,400 | $19,700 | $118,700 |
| 2021 | $1,260 | $116,500 | $18,400 | $98,100 |
| 2020 | $1,286 | $118,700 | $18,400 | $100,300 |
| 2019 | $1,281 | $117,900 | $11,800 | $106,100 |
| 2018 | $1,039 | $106,800 | $11,800 | $95,000 |
| 2017 | $1,010 | $101,000 | $11,800 | $89,200 |
| 2016 | $576 | $95,500 | $11,800 | $83,700 |
| 2014 | $486 | $70,600 | $12,800 | $57,800 |
| 2013 | $486 | $68,700 | $12,800 | $55,900 |
Source: Public Records
Map
Nearby Homes
- 158 Banta St
- 198 W King St
- 163 W King St
- 159 E King St
- 381 Walnut St
- 598 Johnson Ave
- 227 E Jefferson St
- 303 W Jefferson St
- 698 Yandes St
- 76 E Wayne St Unit B
- 955 Graham St
- 185 Oliver Ave
- 598 Kentucky St
- 599 E Adams St
- 851 Duane St
- 690 E Jefferson St
- 365 Province St
- 998 E Jefferson St
- 513 Mallory Pkwy
- 57 14th St
- 348 N Main St
- 396 N Main St
- 40 W Adams St
- 397 N Main St
- 397 N Main St Unit 2
- 397 N Main St Unit 3
- 44 W Adams St
- 2 E Adams St
- 59 Banta St
- 96 W Adams St
- 10 E Adams St
- 399 N Main St
- 399 N Main St Unit 4
- 298 N Main St
- 400 N Main St
- 48 E Adams St
- 99 Banta St
- 401 N Main St Unit B3
- 401 N Main St
- 98 W Adams St
Your Personal Tour Guide
Ask me questions while you tour the home.