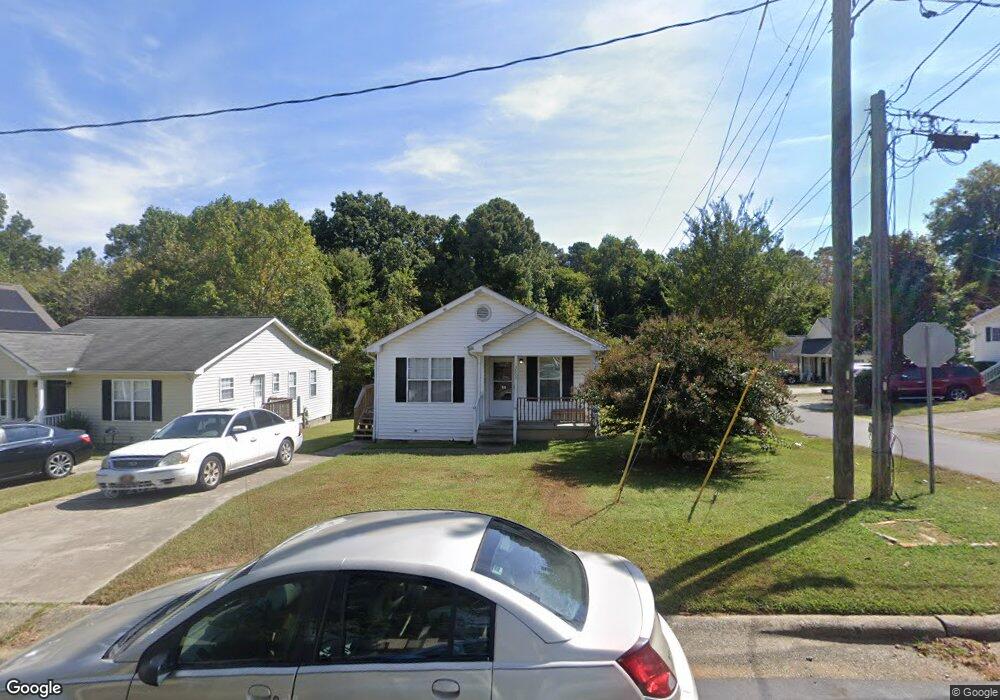
3500 Emily St Durham, NC 27704
Northeast Durham NeighborhoodEstimated Value: $210,000 - $326,000
3
Beds
2
Baths
1,080
Sq Ft
$254/Sq Ft
Est. Value
About This Home
This home is located at 3500 Emily St, Durham, NC 27704 and is currently estimated at $274,128, approximately $253 per square foot. 3500 Emily St is a home located in Durham County with nearby schools including Holt Elementary, George L Carrington Middle, and Northern High School.
Ownership History
Date
Name
Owned For
Owner Type
Purchase Details
Closed on
Feb 11, 2022
Sold by
Tortuga I Llc
Bought by
Tortuga Ii Propco Llc
Current Estimated Value
Home Financials for this Owner
Home Financials are based on the most recent Mortgage that was taken out on this home.
Original Mortgage
$8,572,627
Outstanding Balance
$2,567,310
Interest Rate
3.15%
Mortgage Type
New Conventional
Estimated Equity
-$2,293,182
Purchase Details
Closed on
Dec 10, 2019
Sold by
Barab Deborah Louise and Roberts Deborah B
Bought by
Tortuga I Llc
Home Financials for this Owner
Home Financials are based on the most recent Mortgage that was taken out on this home.
Original Mortgage
$1,023,770
Interest Rate
3.6%
Mortgage Type
Construction
Purchase Details
Closed on
May 4, 2007
Sold by
Roberts Bryant B
Bought by
Roberts Deborah B
Create a Home Valuation Report for This Property
The Home Valuation Report is an in-depth analysis detailing your home's value as well as a comparison with similar homes in the area
Home Values in the Area
Average Home Value in this Area
Purchase History
| Date | Buyer | Sale Price | Title Company |
|---|---|---|---|
| Tortuga Ii Propco Llc | -- | None Listed On Document | |
| Tortuga I Llc | $1,115,000 | None Available | |
| Roberts Deborah B | -- | None Available |
Source: Public Records
Mortgage History
| Date | Status | Borrower | Loan Amount |
|---|---|---|---|
| Open | Tortuga Ii Propco Llc | $8,572,627 | |
| Previous Owner | Tortuga I Llc | $1,023,770 |
Source: Public Records
Tax History
| Year | Tax Paid | Tax Assessment Tax Assessment Total Assessment is a certain percentage of the fair market value that is determined by local assessors to be the total taxable value of land and additions on the property. | Land | Improvement |
|---|---|---|---|---|
| 2025 | $2,463 | $248,486 | $70,000 | $178,486 |
| 2024 | $1,748 | $125,319 | $16,830 | $108,489 |
| 2023 | $1,642 | $125,319 | $16,830 | $108,489 |
| 2022 | $1,604 | $125,319 | $16,830 | $108,489 |
| 2021 | $1,596 | $125,319 | $16,830 | $108,489 |
| 2020 | $1,559 | $125,319 | $16,830 | $108,489 |
| 2019 | $1,559 | $125,319 | $16,830 | $108,489 |
| 2018 | $1,143 | $84,230 | $16,830 | $67,400 |
| 2017 | $1,134 | $84,230 | $16,830 | $67,400 |
| 2016 | $1,144 | $94,116 | $16,830 | $77,286 |
| 2015 | $1,080 | $78,000 | $12,426 | $65,574 |
| 2014 | $1,080 | $78,000 | $12,426 | $65,574 |
Source: Public Records
Map
Nearby Homes
- 3306 Prudence St
- 928 Belvin Ave
- 802 Berwyn Ave
- 201 Denver Ave
- 700 Toronto Ave
- 1123 Allgood St
- 3334 Hinson Dr
- 620 Hoyle St
- 618 Hoyle St
- 422 Craven St
- 714 Old Oxford Rd
- 825 Waring St
- 417 Craven St
- 621 Bon Air Ave
- 3609 Cub Creek Rd
- 3606 Meriwether Dr
- 3001 Corinth Ln
- 617 E Maynard Ave
- 2505 Roanoke St
- 2609 Kingdom Way
Your Personal Tour Guide
Ask me questions while you tour the home.