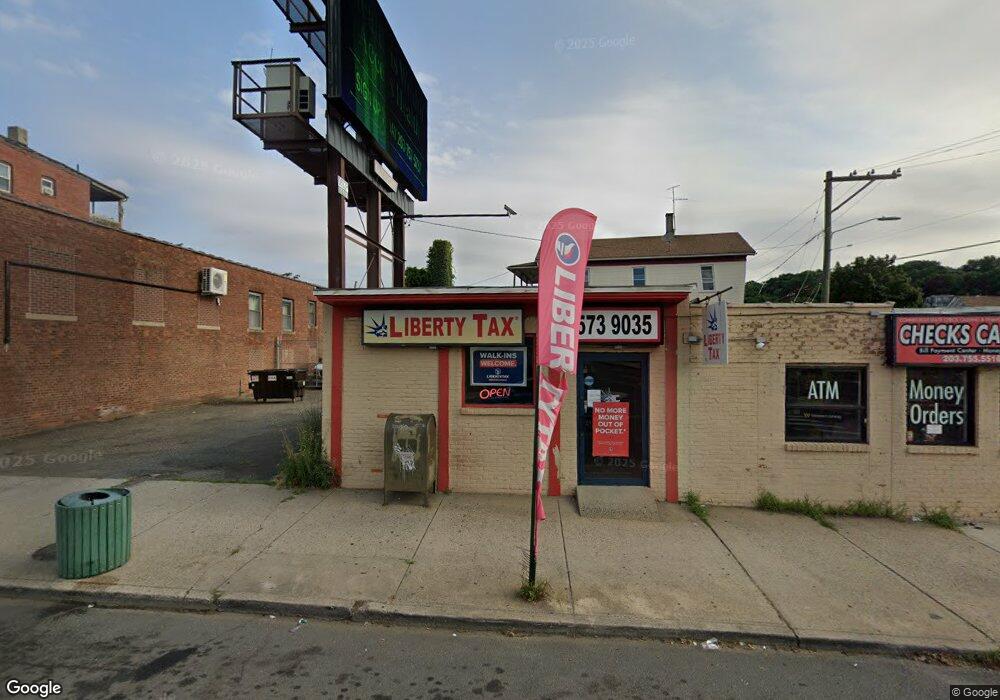
351 E Main St Waterbury, CT 06702
Village of Waterbury Neighborhood
3
Beds
1
Bath
--
Sq Ft
6,970
Sq Ft Lot Lot
About This Home
This home is located at 351 E Main St, Waterbury, CT 06702. 351 E Main St is a home located in New Haven County with nearby schools including H.S. Chase School, West Side Middle School, and John F. Kennedy High School.
Ownership History
Date
Name
Owned For
Owner Type
Purchase Details
Closed on
Mar 9, 2022
Sold by
Collins Terry
Bought by
Collins Terry
Home Financials for this Owner
Home Financials are based on the most recent Mortgage that was taken out on this home.
Original Mortgage
$246,350
Outstanding Balance
$228,092
Interest Rate
3.92%
Mortgage Type
Purchase Money Mortgage
Purchase Details
Closed on
Feb 10, 2022
Sold by
353 East Main Street Llc
Bought by
Nsprodplus Llc
Home Financials for this Owner
Home Financials are based on the most recent Mortgage that was taken out on this home.
Original Mortgage
$246,350
Outstanding Balance
$228,092
Interest Rate
3.92%
Mortgage Type
Purchase Money Mortgage
Purchase Details
Closed on
Jun 17, 2008
Sold by
Collins Terry
Bought by
353 E Main Street Llc and Conn State Props Llc
Purchase Details
Closed on
Dec 8, 1998
Sold by
Yamin Paul J
Bought by
Collins Terry
Home Financials for this Owner
Home Financials are based on the most recent Mortgage that was taken out on this home.
Original Mortgage
$87,500
Interest Rate
6.68%
Mortgage Type
Commercial
Create a Home Valuation Report for This Property
The Home Valuation Report is an in-depth analysis detailing your home's value as well as a comparison with similar homes in the area
Home Values in the Area
Average Home Value in this Area
Purchase History
| Date | Buyer | Sale Price | Title Company |
|---|---|---|---|
| Collins Terry | -- | None Available | |
| Nsprodplus Llc | $189,500 | None Available | |
| Nsprodplus Llc | $189,500 | None Available | |
| Collins Terry | -- | None Available | |
| Collins Terry | -- | None Available | |
| Nsprodplus Llc | $189,500 | None Available | |
| Nsprodplus Llc | $189,500 | None Available | |
| Nsprodplus Llc | $189,500 | None Available | |
| 353 E Main Street Llc | $259,900 | -- | |
| 353 E Main Street Llc | $259,900 | -- | |
| Collins Terry | $110,000 | -- | |
| Collins Terry | $110,000 | -- |
Source: Public Records
Mortgage History
| Date | Status | Borrower | Loan Amount |
|---|---|---|---|
| Open | Nsprodplus Llc | $246,350 | |
| Closed | Nsprodplus Llc | $246,350 | |
| Previous Owner | Collins Terry | $87,500 | |
| Closed | Collins Terry | $25,000 |
Source: Public Records
Tax History
| Year | Tax Paid | Tax Assessment Tax Assessment Total Assessment is a certain percentage of the fair market value that is determined by local assessors to be the total taxable value of land and additions on the property. | Land | Improvement |
|---|---|---|---|---|
| 2025 | $7,361 | $163,660 | $51,450 | $112,210 |
| 2024 | $8,676 | $175,490 | $51,450 | $124,040 |
| 2023 | $9,510 | $175,490 | $51,450 | $124,040 |
| 2022 | $8,178 | $135,820 | $51,470 | $84,350 |
| 2021 | $8,178 | $135,820 | $51,470 | $84,350 |
| 2020 | $8,178 | $135,820 | $51,470 | $84,350 |
| 2019 | $8,178 | $135,820 | $51,470 | $84,350 |
| 2018 | $8,178 | $135,820 | $51,470 | $84,350 |
| 2017 | $8,224 | $136,590 | $51,470 | $85,120 |
| 2016 | $8,224 | $136,590 | $51,470 | $85,120 |
| 2015 | $7,952 | $136,590 | $51,470 | $85,120 |
| 2014 | $7,261 | $124,710 | $39,590 | $85,120 |
Source: Public Records
Map
Nearby Homes
- 325 E Main St
- 309 E Main St
- 309 E Main St Unit 2
- 22 Cherry St
- 27 Cherry St
- 395 E Main St
- 391 E Main St
- 20 Cherry St
- 393 E Main St
- 391 E Main St
- 22 Maple St
- 18 Maple Ave
- 417 E Main St
- 36 Maple St
- 45 Cherry St Unit 2
- 45 Cherry St
- 45 Cherry St Unit 1
- 23 Maple Ave
- 29 Maple Ave Unit 29 maple ave 1 floor
- 46 Cherry St
Your Personal Tour Guide
Ask me questions while you tour the home.