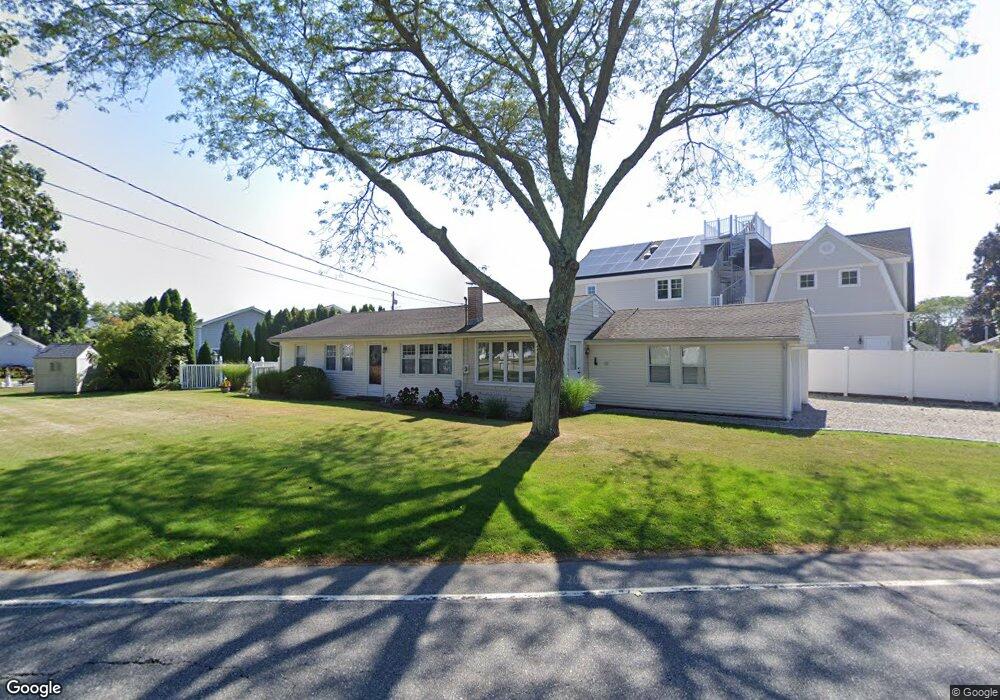
351 Maple Ave Old Saybrook, CT 06475
Estimated Value: $688,024 - $890,000
3
Beds
1
Bath
1,224
Sq Ft
$626/Sq Ft
Est. Value
About This Home
This home is located at 351 Maple Ave, Old Saybrook, CT 06475 and is currently estimated at $765,756, approximately $625 per square foot. 351 Maple Ave is a home located in Middlesex County with nearby schools including Kathleen E. Goodwin School, Old Saybrook Middle School, and Old Saybrook Senior High School.
Ownership History
Date
Name
Owned For
Owner Type
Purchase Details
Closed on
Aug 11, 2021
Sold by
Senack William J
Bought by
William J Senack Irt and Senack
Current Estimated Value
Home Financials for this Owner
Home Financials are based on the most recent Mortgage that was taken out on this home.
Original Mortgage
$114,494
Interest Rate
2.28%
Mortgage Type
New Conventional
Purchase Details
Closed on
May 26, 1993
Sold by
Sokolowski Teri Z
Bought by
Senak William J
Create a Home Valuation Report for This Property
The Home Valuation Report is an in-depth analysis detailing your home's value as well as a comparison with similar homes in the area
Home Values in the Area
Average Home Value in this Area
Purchase History
| Date | Buyer | Sale Price | Title Company |
|---|---|---|---|
| William J Senack Irt | -- | None Available | |
| William J Senack Irt | -- | None Available | |
| Senak William J | $120,000 | -- |
Source: Public Records
Mortgage History
| Date | Status | Borrower | Loan Amount |
|---|---|---|---|
| Previous Owner | William J Senack Irt | $114,494 | |
| Previous Owner | Senak William J | $25,000 |
Source: Public Records
Tax History
| Year | Tax Paid | Tax Assessment Tax Assessment Total Assessment is a certain percentage of the fair market value that is determined by local assessors to be the total taxable value of land and additions on the property. | Land | Improvement |
|---|---|---|---|---|
| 2025 | $5,307 | $342,400 | $195,400 | $147,000 |
| 2024 | $5,204 | $342,400 | $195,400 | $147,000 |
| 2023 | $4,732 | $231,400 | $129,300 | $102,100 |
| 2022 | $4,647 | $231,400 | $129,300 | $102,100 |
| 2021 | $4,640 | $231,400 | $129,300 | $102,100 |
| 2020 | $4,640 | $231,400 | $129,300 | $102,100 |
| 2019 | $4,570 | $231,400 | $129,300 | $102,100 |
| 2018 | $4,537 | $231,500 | $138,300 | $93,200 |
| 2017 | $4,551 | $231,500 | $138,300 | $93,200 |
| 2016 | $4,459 | $231,500 | $138,300 | $93,200 |
| 2015 | $4,355 | $231,500 | $138,300 | $93,200 |
| 2014 | $4,283 | $231,500 | $138,300 | $93,200 |
Source: Public Records
Map
Nearby Homes
- 382 Maple Ave
- 5 Woodland Dr
- 24 Seabreeze Rd
- 10 Edwards Rd
- 1 Beamon Meadow Place
- 7 Ridge Rd
- 24 W Shore Dr
- 6 Point Rd
- 73 Knollwood Dr
- 33 Briarwood Dr
- 105 Fenwood Dr
- 33 Fenwood Rd
- 12 Toms Rd
- 103 Maple Ave
- 23 Clinton Ave
- 11 S View Terrace
- 41 Farview Ave
- 367 Main St Unit 7
- 67 Middletown Ave
- 39 Middletown Ave
Your Personal Tour Guide
Ask me questions while you tour the home.